| __timestamp | Cisco Systems, Inc. | Ubiquiti Inc. |
|---|---|---|
| Wednesday, January 1, 2014 | 19373000000 | 318997000 |
| Thursday, January 1, 2015 | 19480000000 | 333760000 |
| Friday, January 1, 2016 | 18287000000 | 341600000 |
| Sunday, January 1, 2017 | 17781000000 | 469560000 |
| Monday, January 1, 2018 | 18724000000 | 573289000 |
| Tuesday, January 1, 2019 | 19238000000 | 624129000 |
| Wednesday, January 1, 2020 | 17618000000 | 676328000 |
| Friday, January 1, 2021 | 17924000000 | 985818000 |
| Saturday, January 1, 2022 | 19309000000 | 1021880000 |
| Sunday, January 1, 2023 | 21245000000 | 1179781000 |
| Monday, January 1, 2024 | 18975000000 | 1188728000 |
Infusing magic into the data realm
In the ever-evolving tech landscape, Cisco Systems, Inc. and Ubiquiti Inc. have carved distinct paths in managing their cost of revenue. From 2014 to 2024, Cisco's cost of revenue has shown a steady trend, peaking in 2023 with a 10% increase from its 2014 figures. This reflects Cisco's robust infrastructure and strategic investments in networking solutions. In contrast, Ubiquiti Inc. has experienced a remarkable growth trajectory, with its cost of revenue surging by nearly 270% over the same period. This growth underscores Ubiquiti's aggressive expansion in the wireless communication sector. While Cisco's cost of revenue remains significantly higher, Ubiquiti's rapid growth highlights its potential to disrupt the market. As we look to the future, these trends offer valuable insights into the strategic priorities and market positioning of these tech titans.
"Cisco vs. Ubiquiti: A Decade of Cost Dynamics"
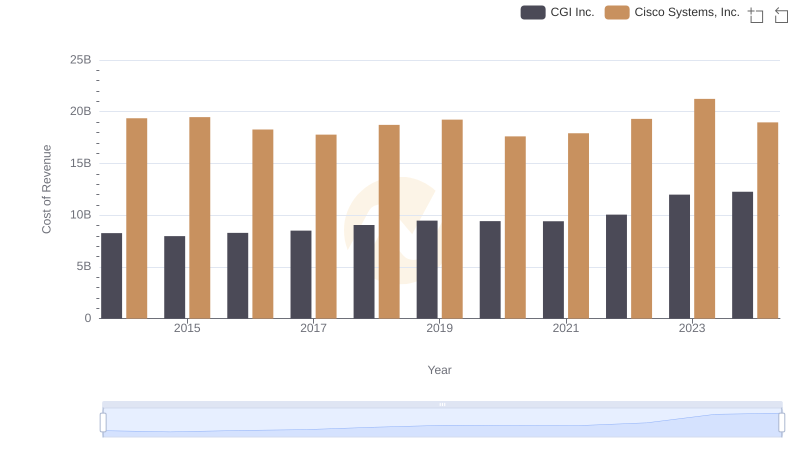
Cisco Systems, Inc. vs CGI Inc.: Efficiency in Cost of Revenue Explored
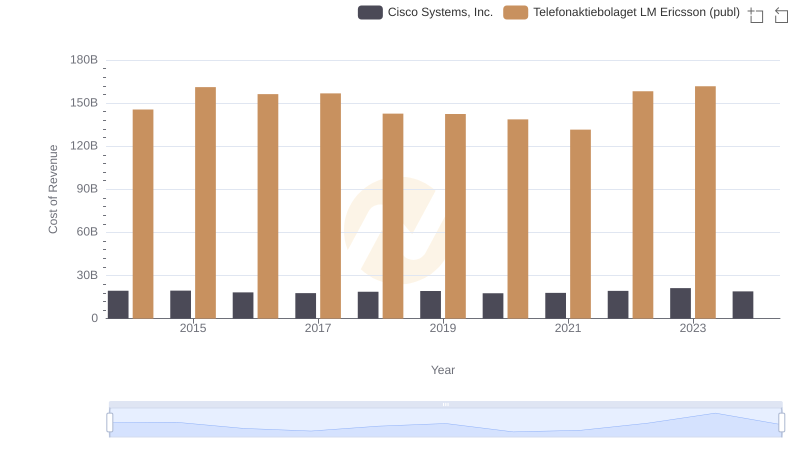
Cost of Revenue: Key Insights for Cisco Systems, Inc. and Telefonaktiebolaget LM Ericsson (publ)
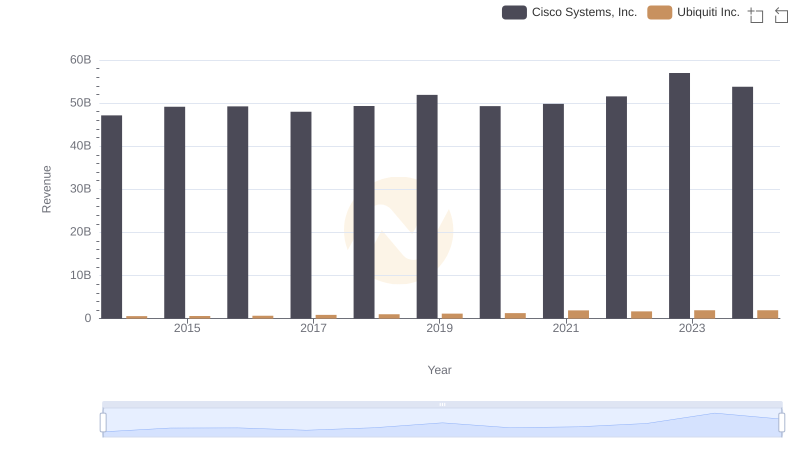
Revenue Insights: Cisco Systems, Inc. and Ubiquiti Inc. Performance Compared
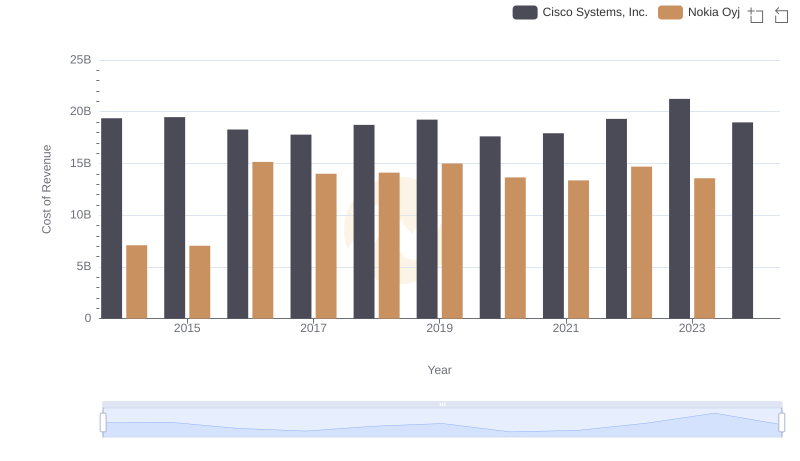
Cost Insights: Breaking Down Cisco Systems, Inc. and Nokia Oyj's Expenses
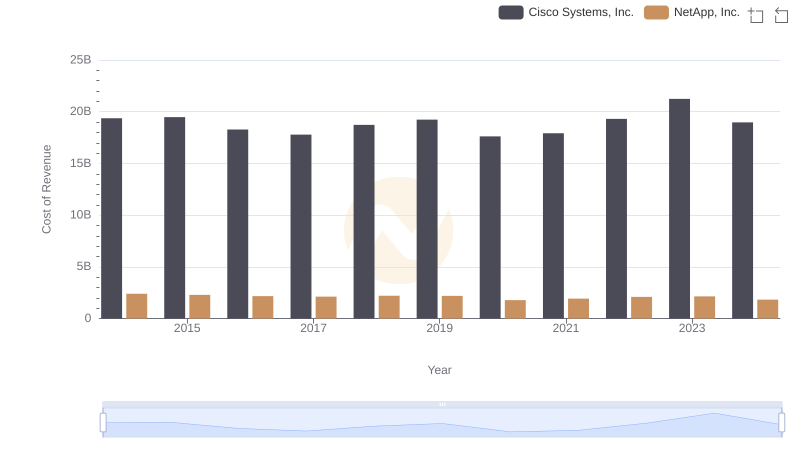
Comparing Cost of Revenue Efficiency: Cisco Systems, Inc. vs NetApp, Inc.
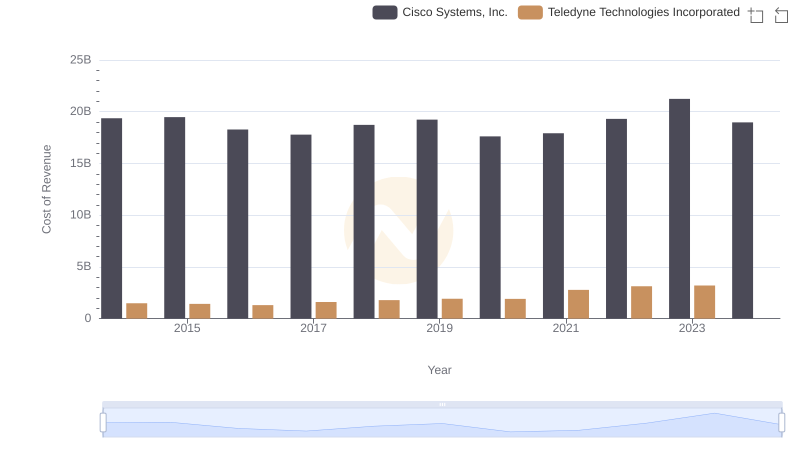
Cost of Revenue Comparison: Cisco Systems, Inc. vs Teledyne Technologies Incorporated
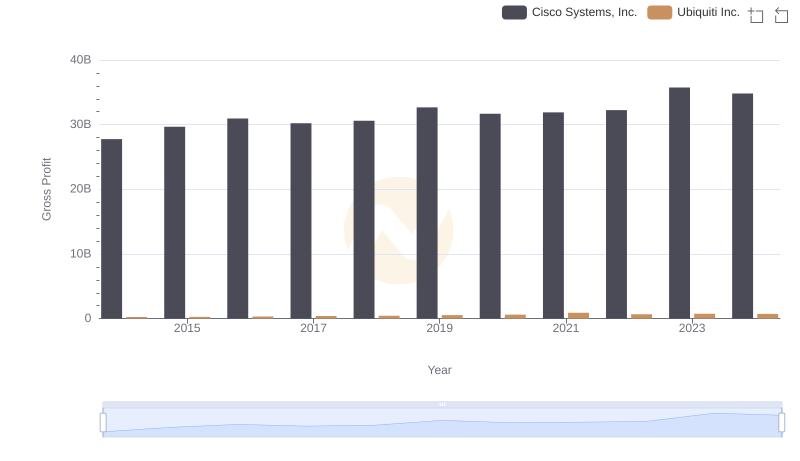
Cisco Systems, Inc. and Ubiquiti Inc.: A Detailed Gross Profit Analysis
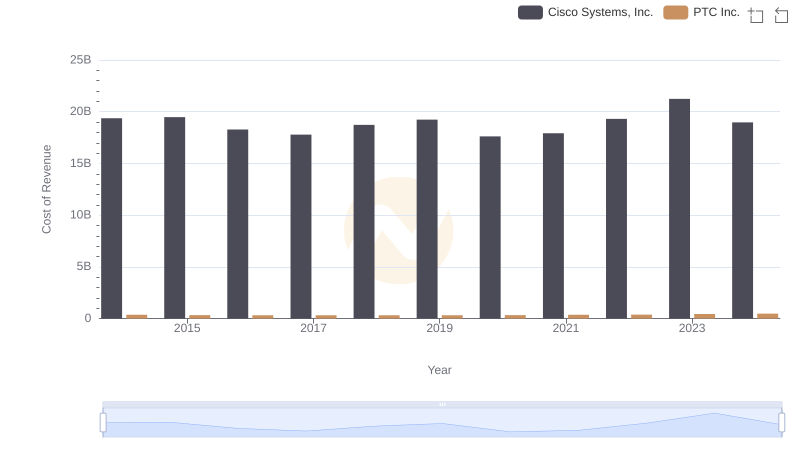
Cost Insights: Breaking Down Cisco Systems, Inc. and PTC Inc.'s Expenses
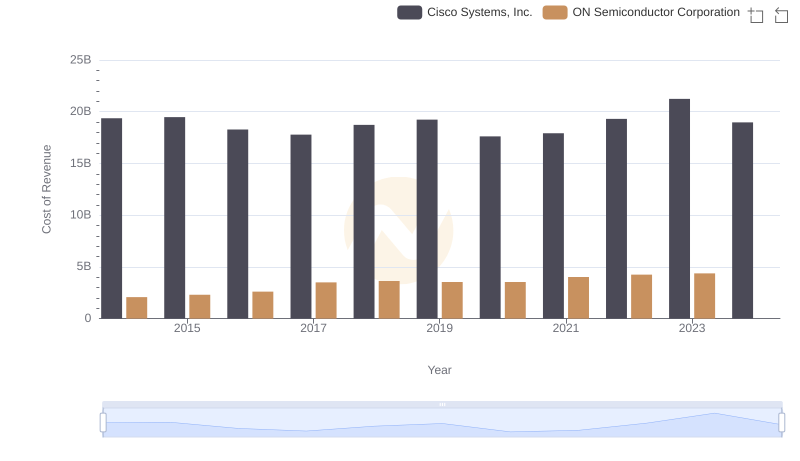
Cost of Revenue Trends: Cisco Systems, Inc. vs ON Semiconductor Corporation
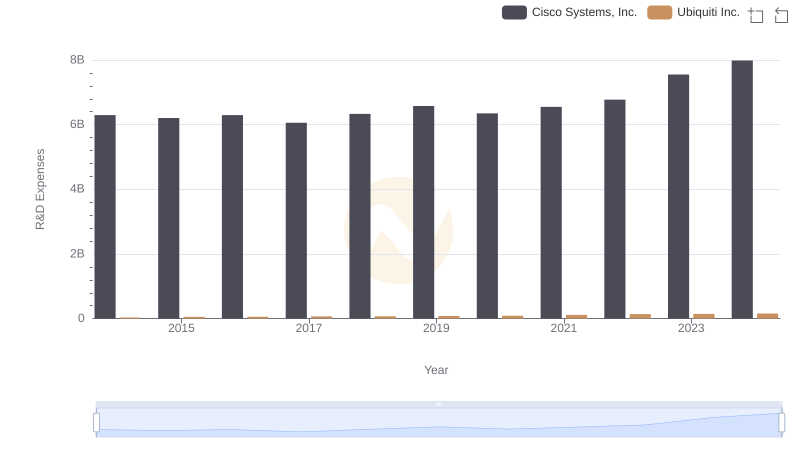
R&D Spending Showdown: Cisco Systems, Inc. vs Ubiquiti Inc.
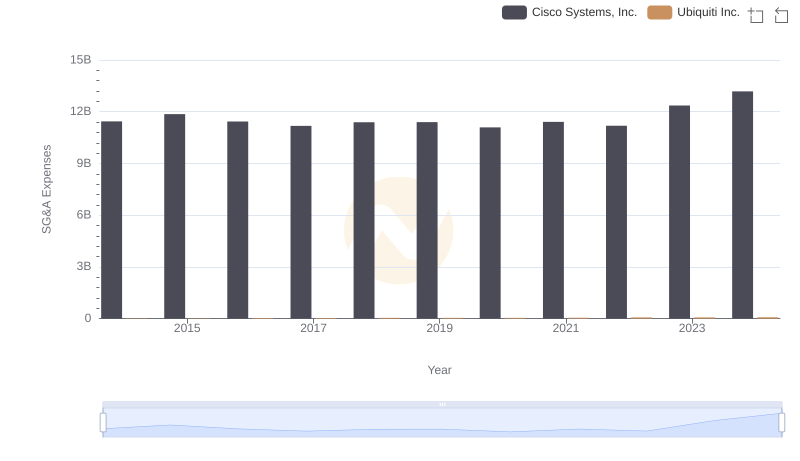
Cisco Systems, Inc. vs Ubiquiti Inc.: SG&A Expense Trends
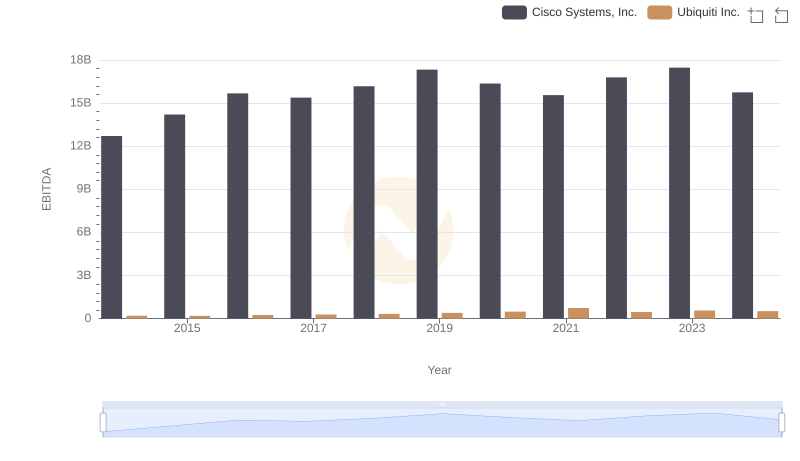
Comprehensive EBITDA Comparison: Cisco Systems, Inc. vs Ubiquiti Inc.