| __timestamp | Cisco Systems, Inc. | NetApp, Inc. |
|---|---|---|
| Wednesday, January 1, 2014 | 27769000000 | 3919100000 |
| Thursday, January 1, 2015 | 29681000000 | 3833200000 |
| Friday, January 1, 2016 | 30960000000 | 3373000000 |
| Sunday, January 1, 2017 | 30224000000 | 3390000000 |
| Monday, January 1, 2018 | 30606000000 | 3699000000 |
| Tuesday, January 1, 2019 | 32666000000 | 3945000000 |
| Wednesday, January 1, 2020 | 31683000000 | 3623000000 |
| Friday, January 1, 2021 | 31894000000 | 3815000000 |
| Saturday, January 1, 2022 | 32248000000 | 4220000000 |
| Sunday, January 1, 2023 | 35753000000 | 4209000000 |
| Monday, January 1, 2024 | 34828000000 | 4433000000 |
Unleashing insights
In the ever-evolving tech industry, understanding financial performance is crucial. This analysis compares the gross profit trends of Cisco Systems, Inc. and NetApp, Inc. from 2014 to 2024. Cisco, a leader in networking solutions, consistently outperformed NetApp, a data management company, with an average gross profit nearly eight times higher. Notably, Cisco's gross profit surged by approximately 25% from 2014 to 2023, peaking at $35.75 billion in 2023. Meanwhile, NetApp's growth was more modest, with a 13% increase over the same period, reaching $4.43 billion in 2024. This disparity highlights Cisco's robust market position and strategic growth initiatives. As the tech landscape continues to shift, these insights offer a glimpse into the financial health and competitive dynamics of these industry giants.
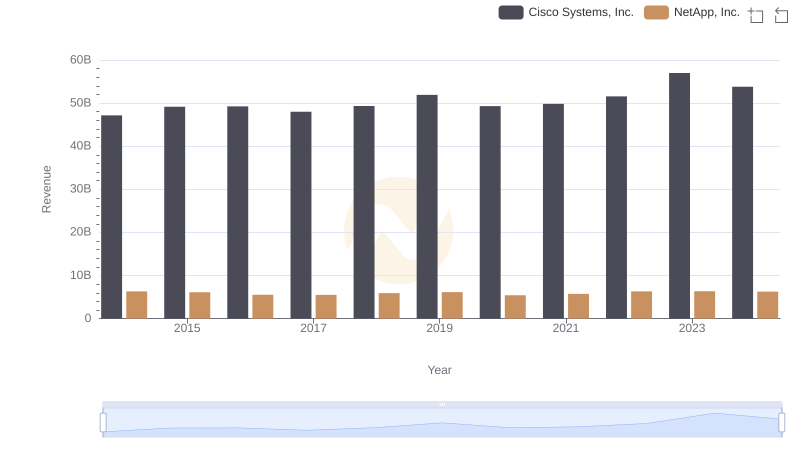
Who Generates More Revenue? Cisco Systems, Inc. or NetApp, Inc.
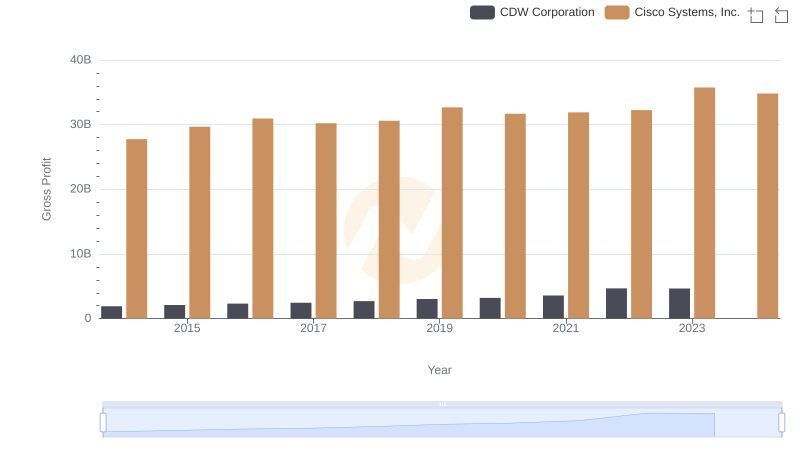
Cisco Systems, Inc. vs CDW Corporation: A Gross Profit Performance Breakdown
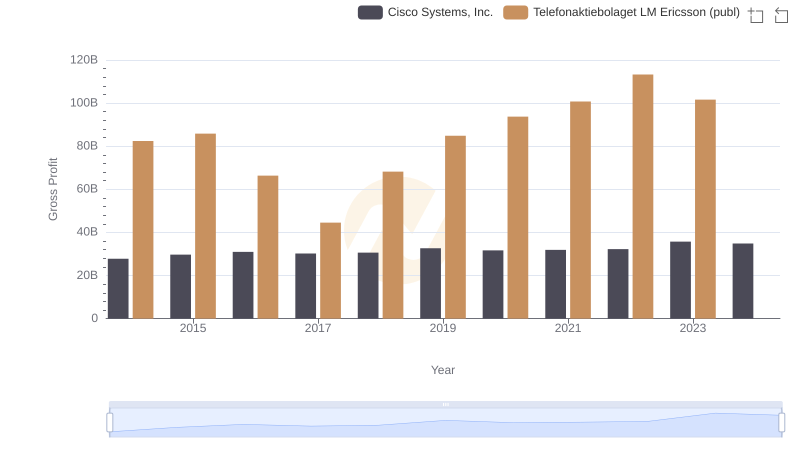
Cisco Systems, Inc. vs Telefonaktiebolaget LM Ericsson (publ): A Gross Profit Performance Breakdown
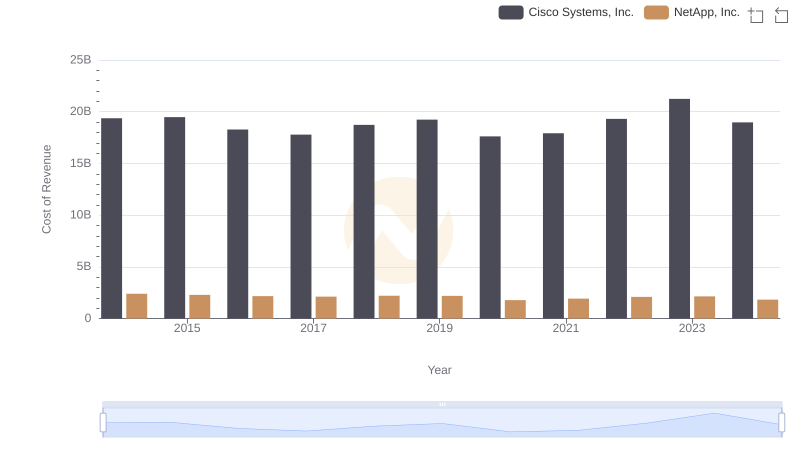
Comparing Cost of Revenue Efficiency: Cisco Systems, Inc. vs NetApp, Inc.
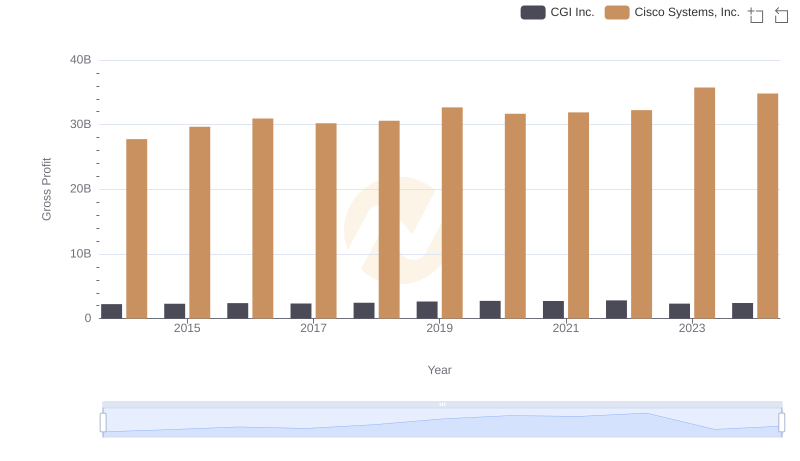
Key Insights on Gross Profit: Cisco Systems, Inc. vs CGI Inc.
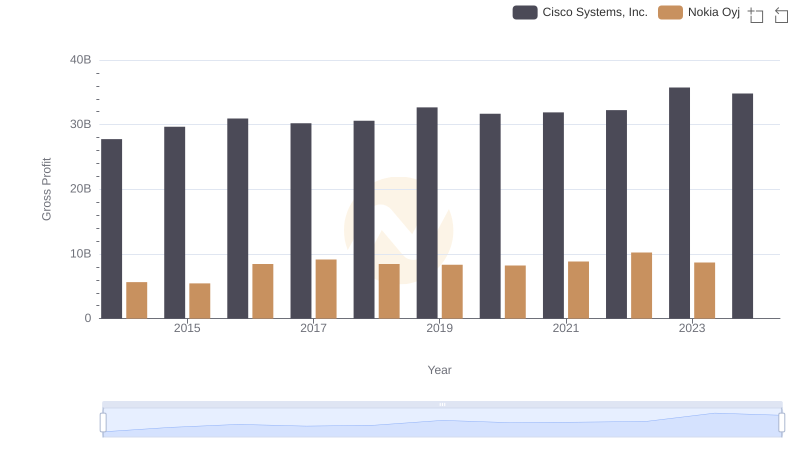
Gross Profit Comparison: Cisco Systems, Inc. and Nokia Oyj Trends
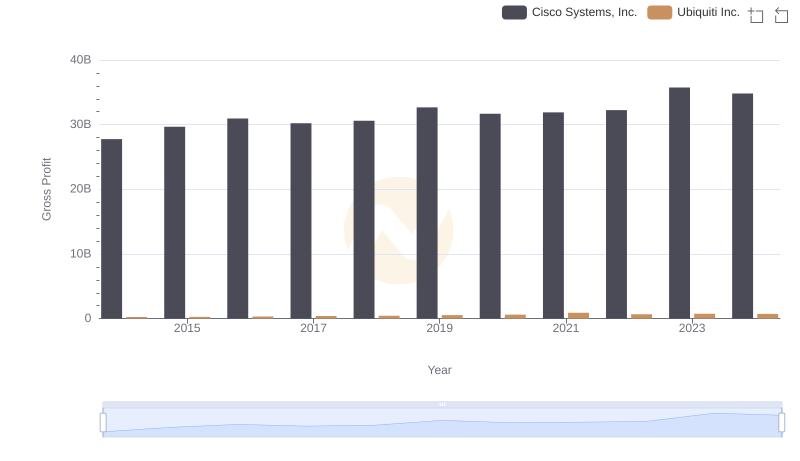
Cisco Systems, Inc. and Ubiquiti Inc.: A Detailed Gross Profit Analysis
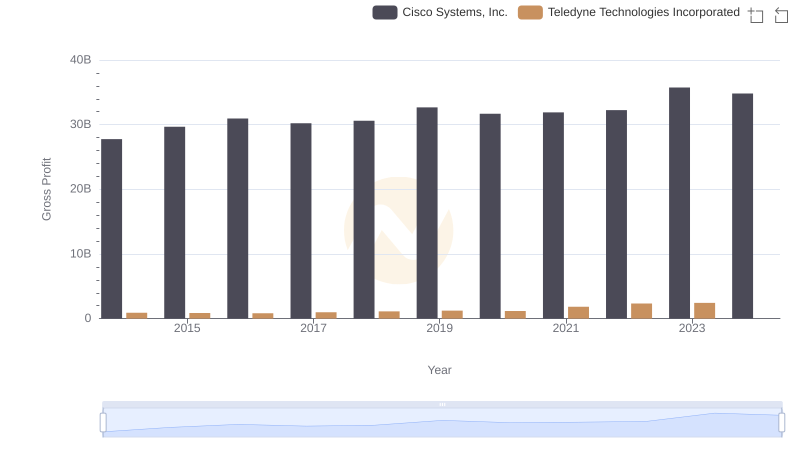
Gross Profit Trends Compared: Cisco Systems, Inc. vs Teledyne Technologies Incorporated
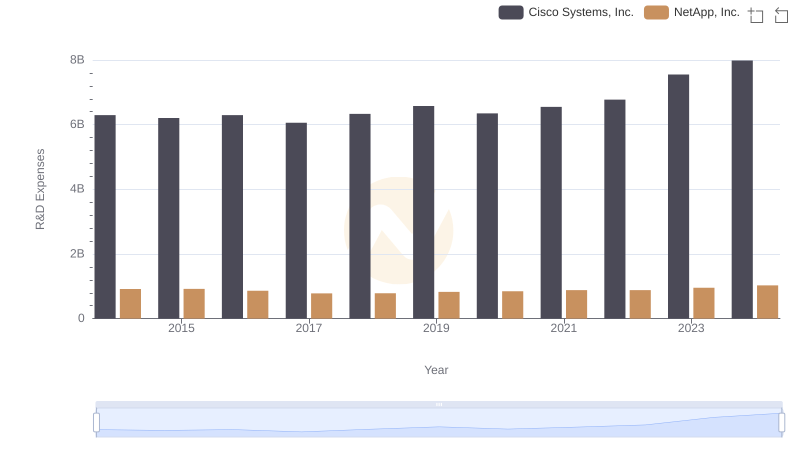
R&D Spending Showdown: Cisco Systems, Inc. vs NetApp, Inc.
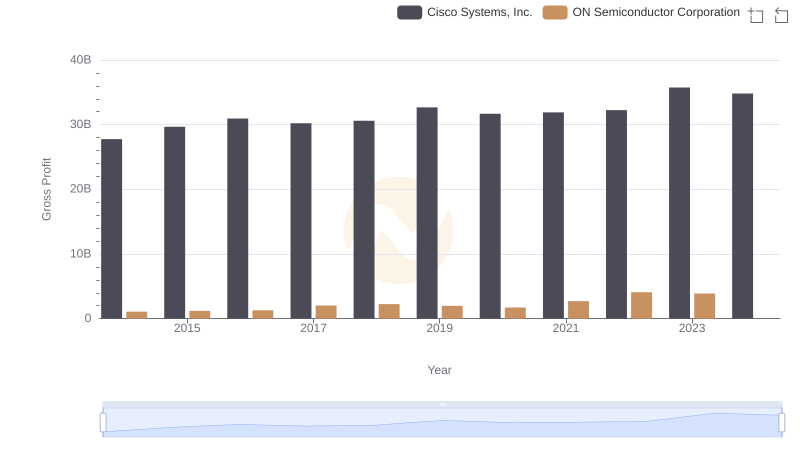
Gross Profit Analysis: Comparing Cisco Systems, Inc. and ON Semiconductor Corporation
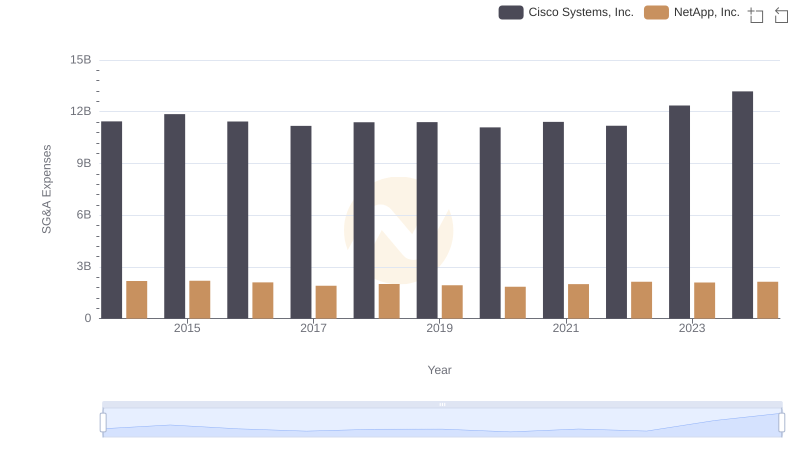
Cost Management Insights: SG&A Expenses for Cisco Systems, Inc. and NetApp, Inc.
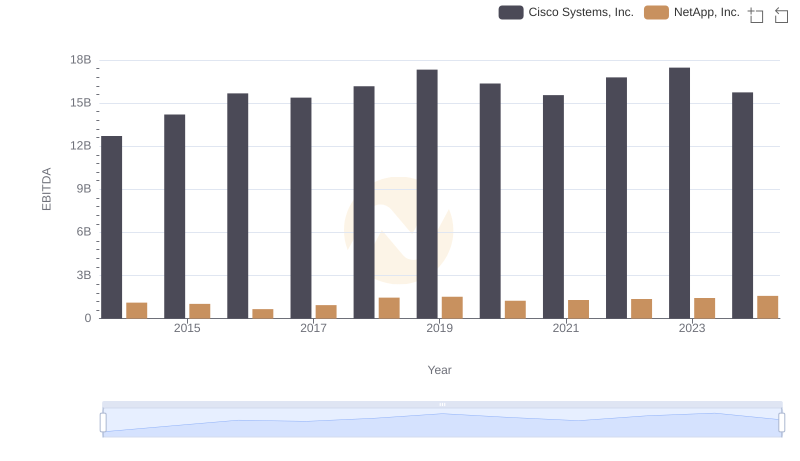
A Side-by-Side Analysis of EBITDA: Cisco Systems, Inc. and NetApp, Inc.