| __timestamp | Rockwell Automation, Inc. | TransUnion |
|---|---|---|
| Wednesday, January 1, 2014 | 6623500000 | 1304700000 |
| Thursday, January 1, 2015 | 6307900000 | 1506800000 |
| Friday, January 1, 2016 | 5879500000 | 1704900000 |
| Sunday, January 1, 2017 | 6311300000 | 1933800000 |
| Monday, January 1, 2018 | 6666000000 | 2317200000 |
| Tuesday, January 1, 2019 | 6694800000 | 2656100000 |
| Wednesday, January 1, 2020 | 6329800000 | 2716600000 |
| Friday, January 1, 2021 | 6997400000 | 2960200000 |
| Saturday, January 1, 2022 | 7760400000 | 3709900000 |
| Sunday, January 1, 2023 | 9058000000 | 3831200000 |
| Monday, January 1, 2024 | 8264200000 | 4183800000 |
Igniting the spark of knowledge
In the ever-evolving landscape of industrial automation and credit reporting, Rockwell Automation, Inc. and TransUnion have showcased intriguing revenue trajectories from 2014 to 2023. Rockwell Automation, a leader in industrial automation, has seen its revenue grow by approximately 37% over this period, peaking in 2023. This growth reflects the increasing demand for automation solutions in a rapidly digitizing world. Meanwhile, TransUnion, a key player in the credit reporting industry, has experienced a remarkable 194% revenue increase, underscoring the rising importance of data analytics and credit information in financial decision-making. Notably, 2024 data for TransUnion is missing, leaving room for speculation on its future performance. As these giants continue to innovate, their revenue trends offer valuable insights into the broader economic shifts and technological advancements shaping their respective industries.
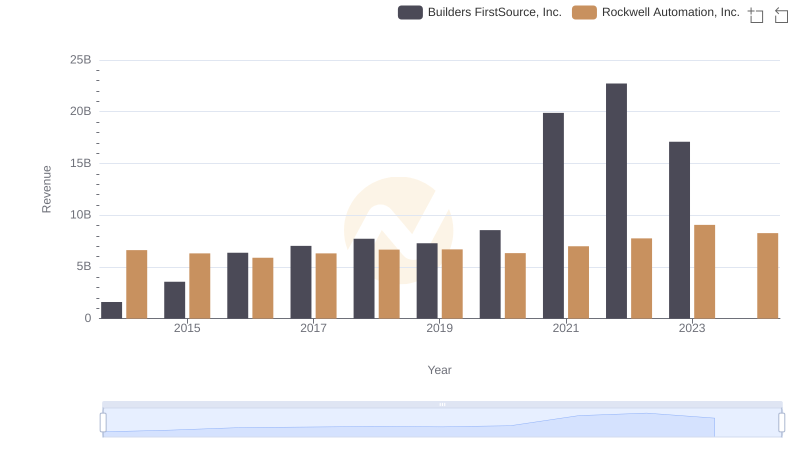
Revenue Insights: Rockwell Automation, Inc. and Builders FirstSource, Inc. Performance Compared
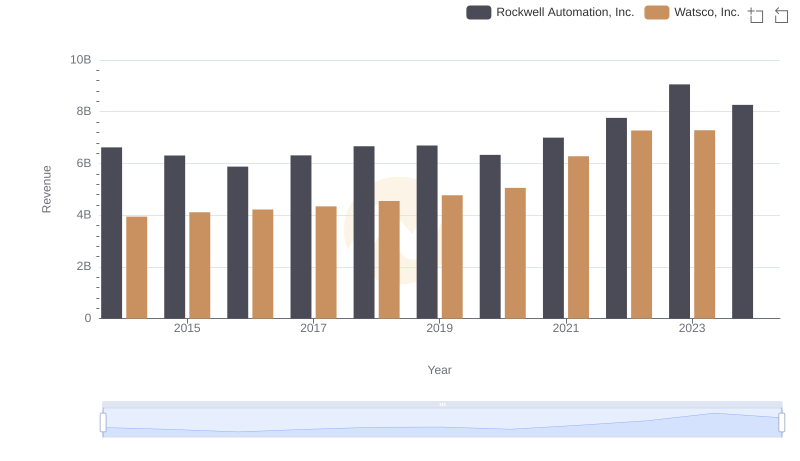
Annual Revenue Comparison: Rockwell Automation, Inc. vs Watsco, Inc.
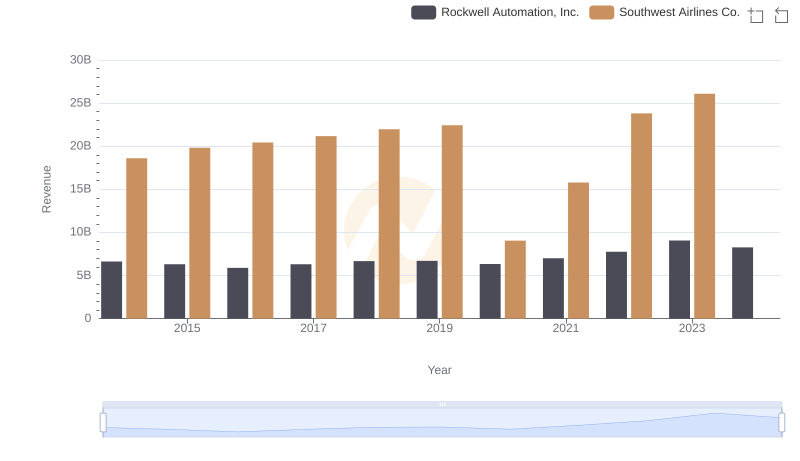
Revenue Showdown: Rockwell Automation, Inc. vs Southwest Airlines Co.
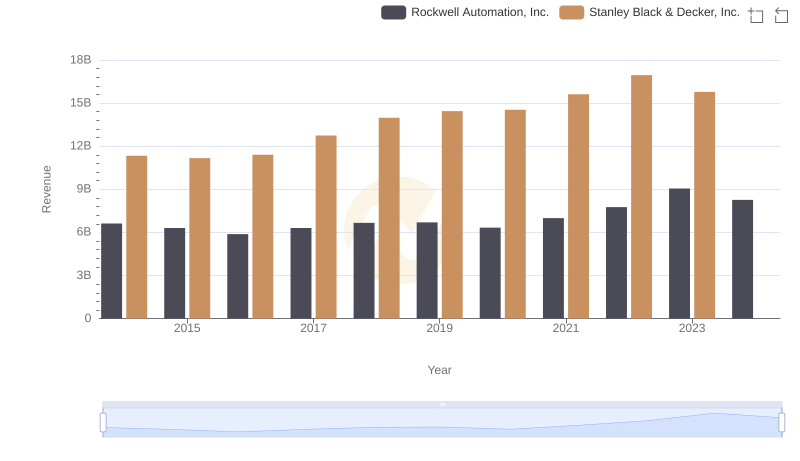
Who Generates More Revenue? Rockwell Automation, Inc. or Stanley Black & Decker, Inc.

Cost Insights: Breaking Down Rockwell Automation, Inc. and TransUnion's Expenses
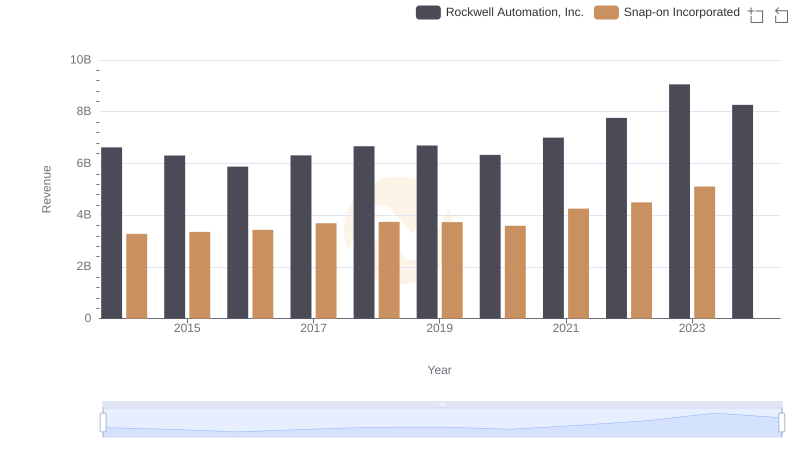
Rockwell Automation, Inc. or Snap-on Incorporated: Who Leads in Yearly Revenue?
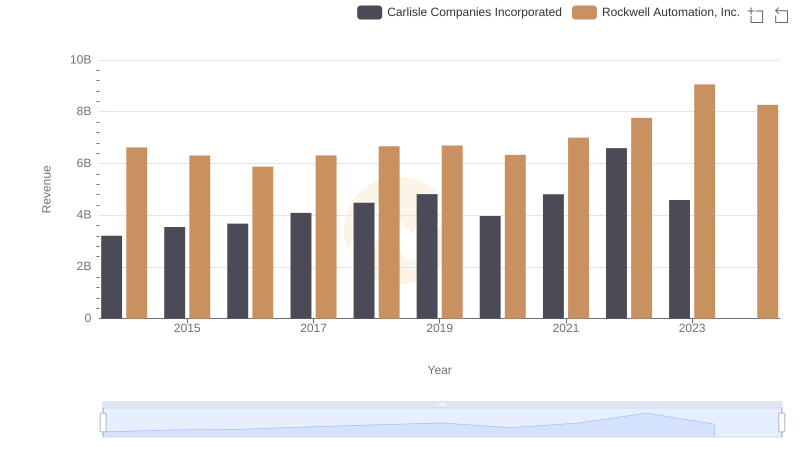
Rockwell Automation, Inc. vs Carlisle Companies Incorporated: Examining Key Revenue Metrics
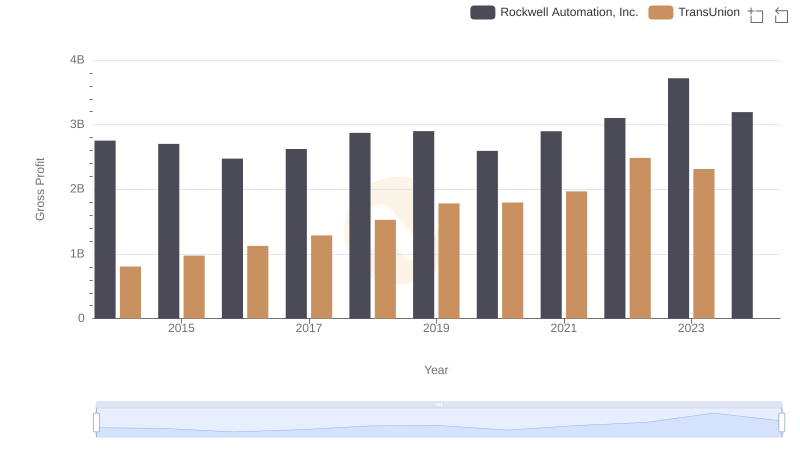
Rockwell Automation, Inc. and TransUnion: A Detailed Gross Profit Analysis
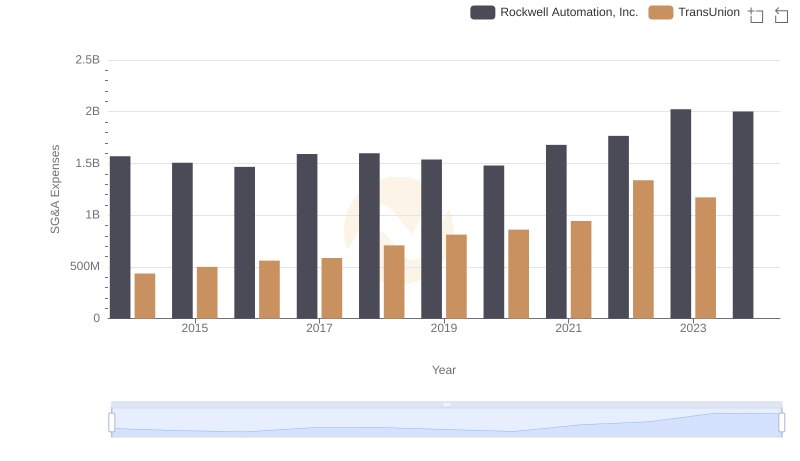
Breaking Down SG&A Expenses: Rockwell Automation, Inc. vs TransUnion
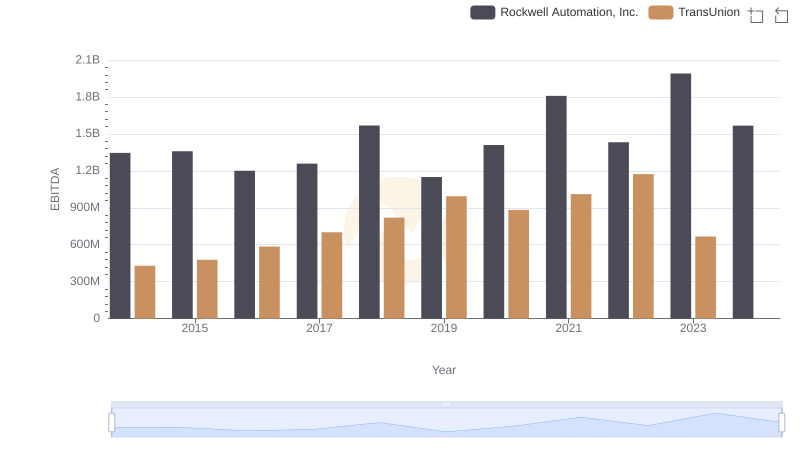
Comparative EBITDA Analysis: Rockwell Automation, Inc. vs TransUnion