| __timestamp | Rockwell Automation, Inc. | TransUnion |
|---|---|---|
| Wednesday, January 1, 2014 | 2753900000 | 805600000 |
| Thursday, January 1, 2015 | 2703100000 | 975200000 |
| Friday, January 1, 2016 | 2475500000 | 1125800000 |
| Sunday, January 1, 2017 | 2624200000 | 1288100000 |
| Monday, January 1, 2018 | 2872200000 | 1527100000 |
| Tuesday, January 1, 2019 | 2900100000 | 1782000000 |
| Wednesday, January 1, 2020 | 2595200000 | 1796200000 |
| Friday, January 1, 2021 | 2897700000 | 1968600000 |
| Saturday, January 1, 2022 | 3102000000 | 2487000000 |
| Sunday, January 1, 2023 | 3717000000 | 2313900000 |
| Monday, January 1, 2024 | 3193400000 | 4183800000 |
Unleashing insights
In the ever-evolving landscape of industrial automation and credit reporting, Rockwell Automation, Inc. and TransUnion have showcased intriguing financial trajectories over the past decade. From 2014 to 2023, Rockwell Automation's gross profit surged by approximately 35%, peaking in 2023. This growth reflects the company's robust adaptation to technological advancements and market demands. Meanwhile, TransUnion's gross profit nearly tripled, highlighting its strategic expansion in data analytics and credit solutions.
Interestingly, 2022 marked a pivotal year for both companies, with Rockwell Automation achieving a 7% increase in gross profit, while TransUnion reached its zenith. However, 2024 data for TransUnion remains elusive, leaving room for speculation on its future performance. This analysis underscores the dynamic nature of these industries and the companies' resilience in navigating economic challenges.
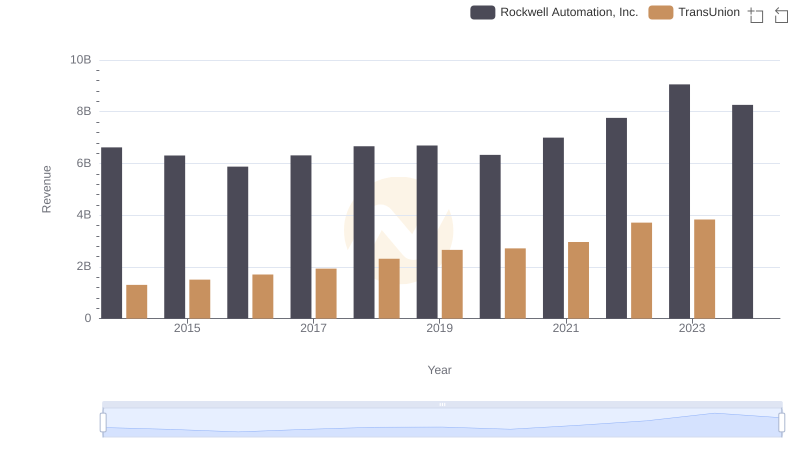
Revenue Showdown: Rockwell Automation, Inc. vs TransUnion
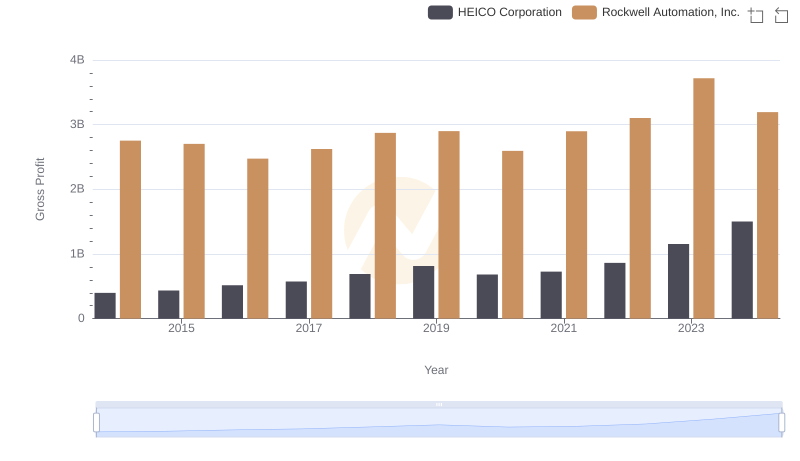
Gross Profit Analysis: Comparing Rockwell Automation, Inc. and HEICO Corporation
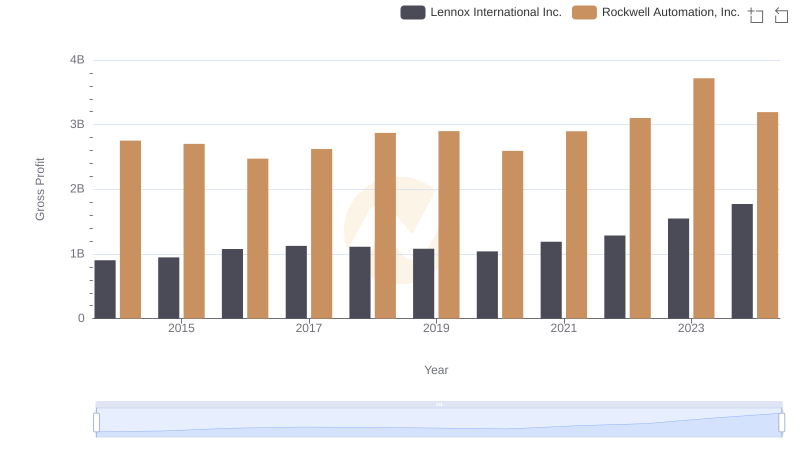
Rockwell Automation, Inc. vs Lennox International Inc.: A Gross Profit Performance Breakdown

Key Insights on Gross Profit: Rockwell Automation, Inc. vs Hubbell Incorporated

Cost Insights: Breaking Down Rockwell Automation, Inc. and TransUnion's Expenses
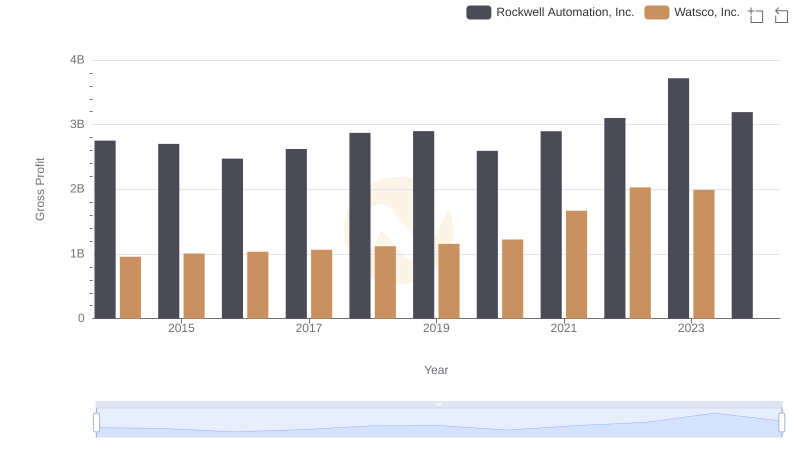
Rockwell Automation, Inc. vs Watsco, Inc.: A Gross Profit Performance Breakdown
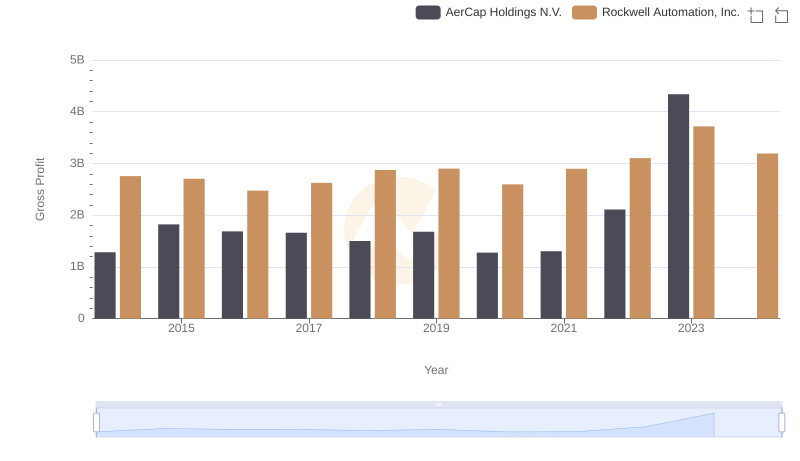
Gross Profit Comparison: Rockwell Automation, Inc. and AerCap Holdings N.V. Trends
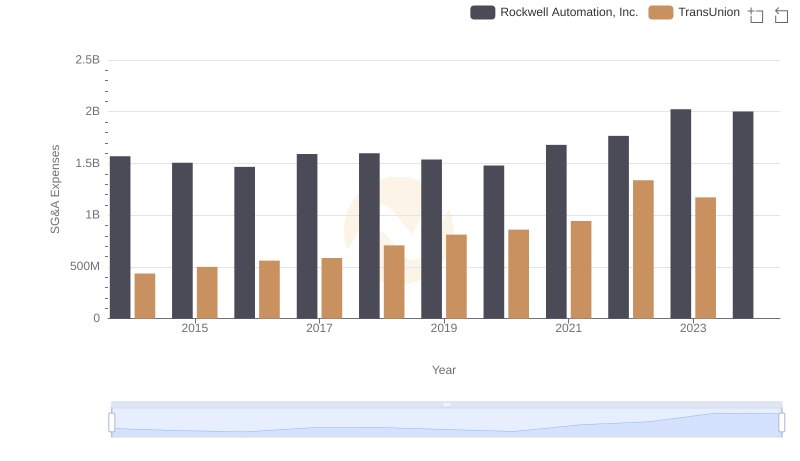
Breaking Down SG&A Expenses: Rockwell Automation, Inc. vs TransUnion
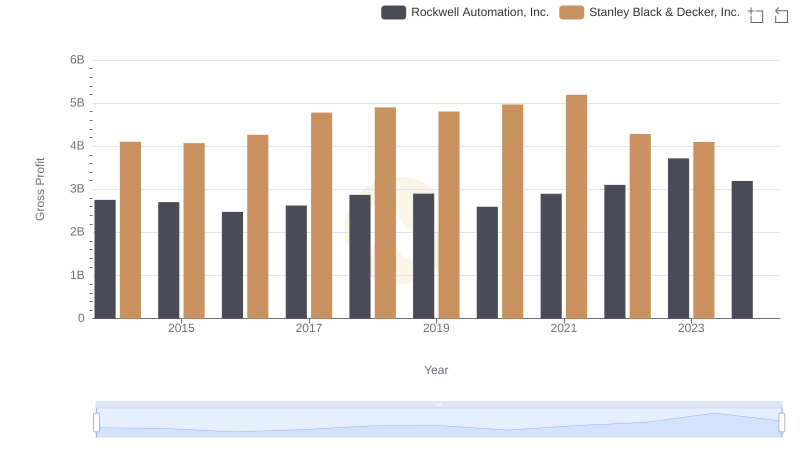
Who Generates Higher Gross Profit? Rockwell Automation, Inc. or Stanley Black & Decker, Inc.
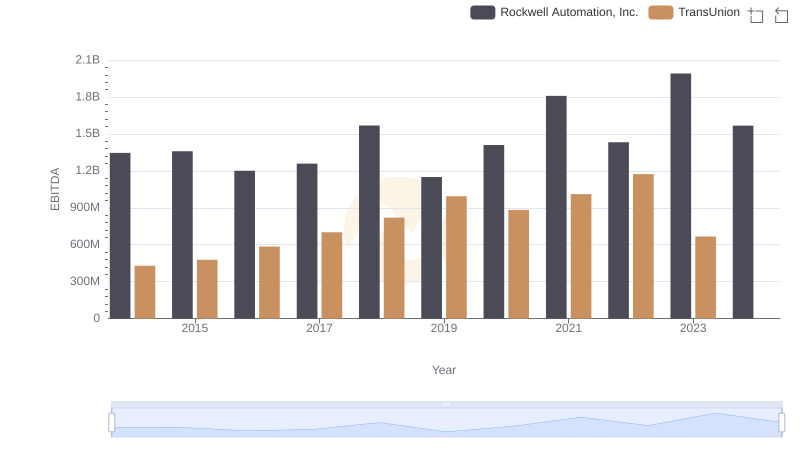
Comparative EBITDA Analysis: Rockwell Automation, Inc. vs TransUnion