| __timestamp | Rockwell Automation, Inc. | TransUnion |
|---|---|---|
| Wednesday, January 1, 2014 | 3869600000 | 499100000 |
| Thursday, January 1, 2015 | 3604800000 | 531600000 |
| Friday, January 1, 2016 | 3404000000 | 579100000 |
| Sunday, January 1, 2017 | 3687100000 | 645700000 |
| Monday, January 1, 2018 | 3793800000 | 790100000 |
| Tuesday, January 1, 2019 | 3794700000 | 874100000 |
| Wednesday, January 1, 2020 | 3734600000 | 920400000 |
| Friday, January 1, 2021 | 4099700000 | 991600000 |
| Saturday, January 1, 2022 | 4658400000 | 1222900000 |
| Sunday, January 1, 2023 | 5341000000 | 1517300000 |
| Monday, January 1, 2024 | 5070800000 | 0 |
In pursuit of knowledge
In the ever-evolving landscape of industrial automation and credit reporting, understanding cost structures is crucial. Rockwell Automation, Inc. and TransUnion, two giants in their respective fields, have shown distinct trends in their cost of revenue over the past decade. From 2014 to 2023, Rockwell Automation's costs surged by approximately 38%, peaking in 2023. This reflects their aggressive expansion and innovation strategies. Meanwhile, TransUnion's costs increased by over 200% during the same period, highlighting their investment in data security and analytics.
These trends underscore the dynamic nature of these industries, where cost management is as pivotal as revenue growth. Missing data for 2024 suggests ongoing developments, warranting close attention.
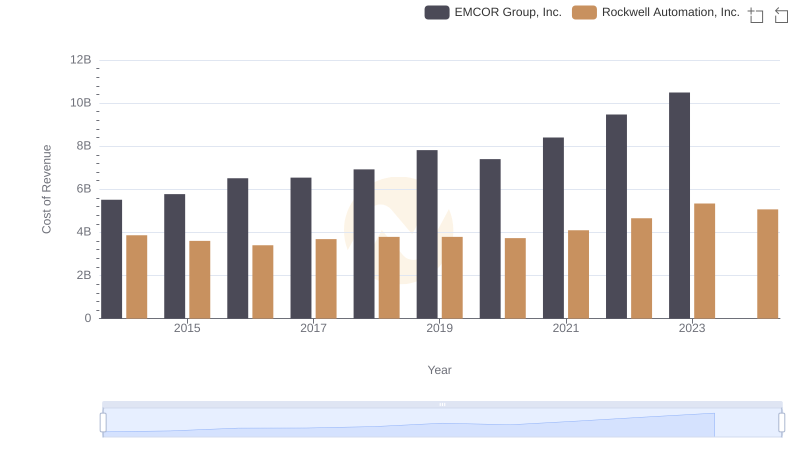
Cost of Revenue Comparison: Rockwell Automation, Inc. vs EMCOR Group, Inc.
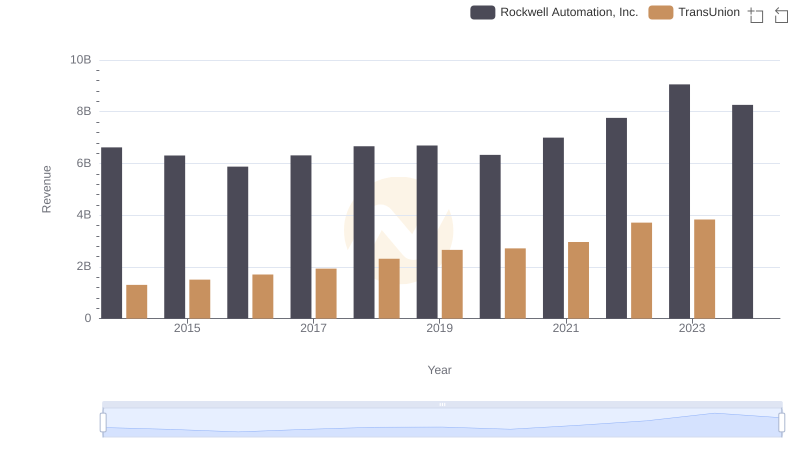
Revenue Showdown: Rockwell Automation, Inc. vs TransUnion
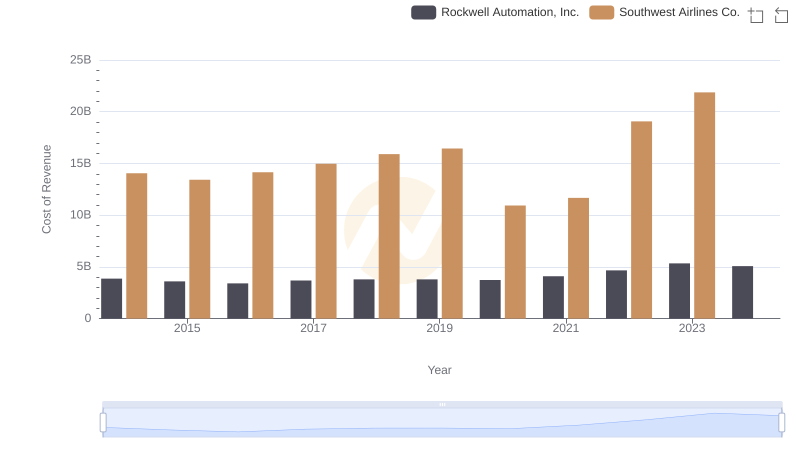
Cost Insights: Breaking Down Rockwell Automation, Inc. and Southwest Airlines Co.'s Expenses
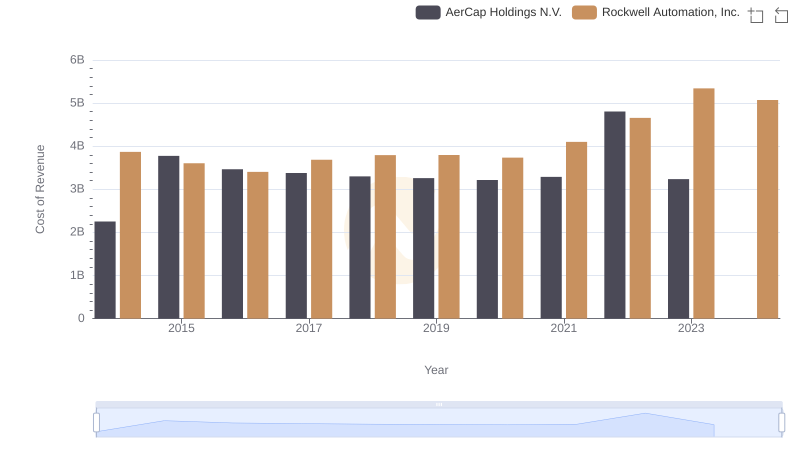
Analyzing Cost of Revenue: Rockwell Automation, Inc. and AerCap Holdings N.V.
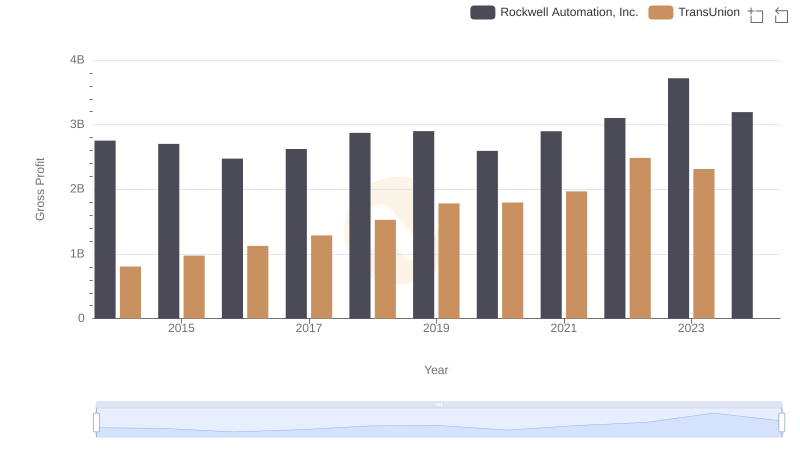
Rockwell Automation, Inc. and TransUnion: A Detailed Gross Profit Analysis
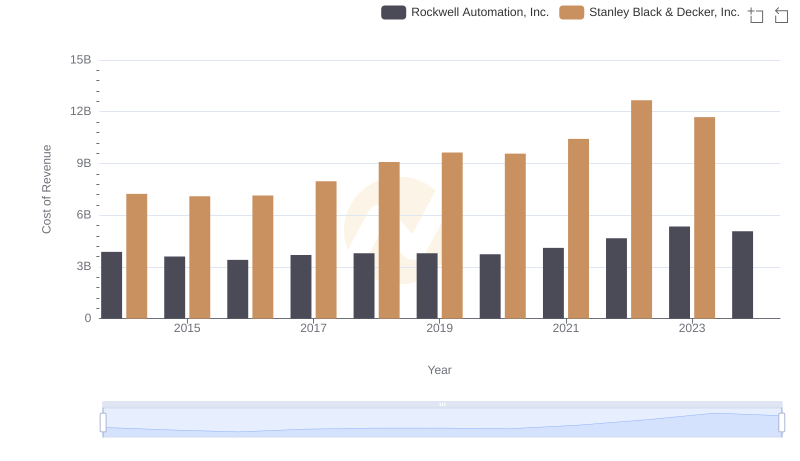
Comparing Cost of Revenue Efficiency: Rockwell Automation, Inc. vs Stanley Black & Decker, Inc.
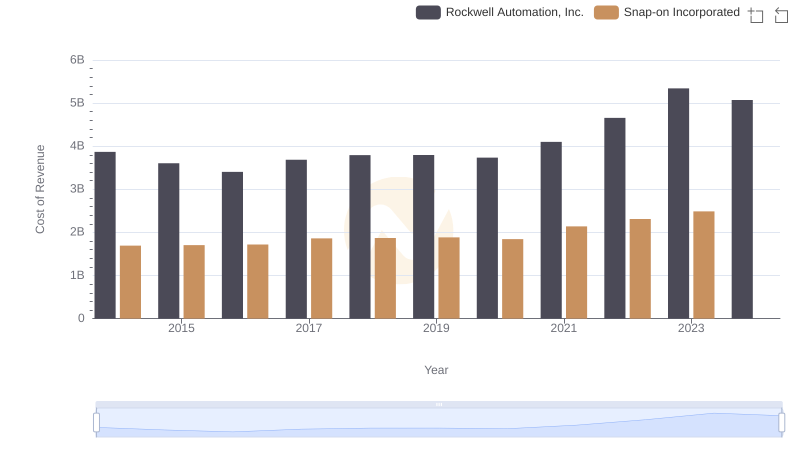
Cost Insights: Breaking Down Rockwell Automation, Inc. and Snap-on Incorporated's Expenses
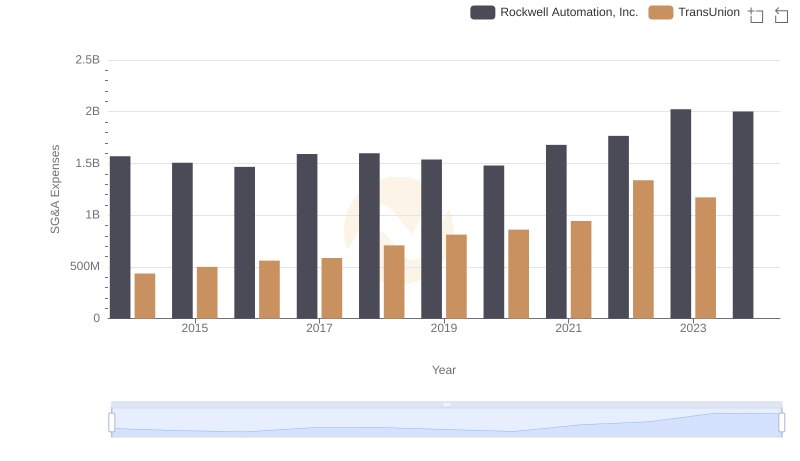
Breaking Down SG&A Expenses: Rockwell Automation, Inc. vs TransUnion
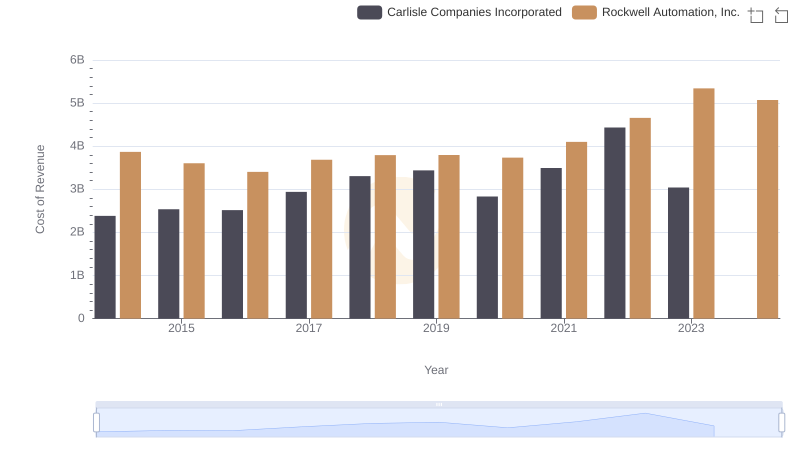
Cost of Revenue Trends: Rockwell Automation, Inc. vs Carlisle Companies Incorporated
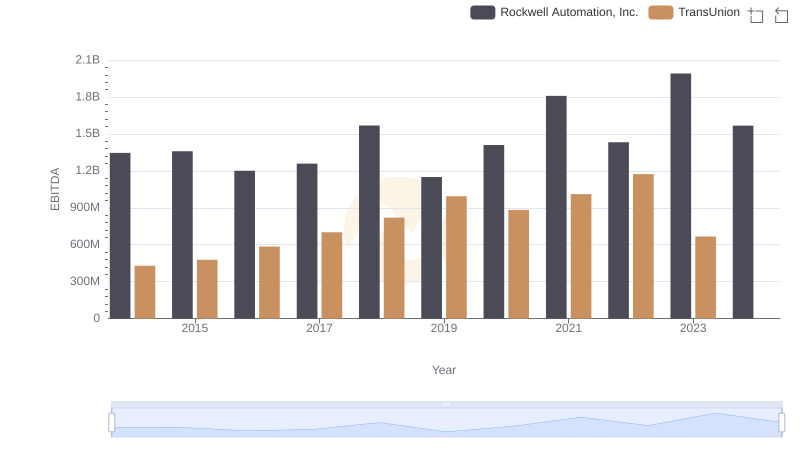
Comparative EBITDA Analysis: Rockwell Automation, Inc. vs TransUnion