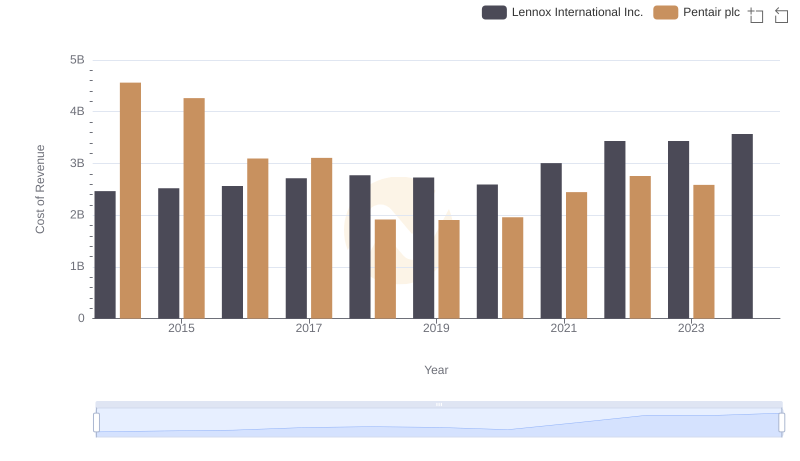
| __timestamp | Lennox International Inc. | Pentair plc |
|---|---|---|
| Wednesday, January 1, 2014 | 3367400000 | 7039000000 |
| Thursday, January 1, 2015 | 3467400000 | 6449000000 |
| Friday, January 1, 2016 | 3641600000 | 4890000000 |
| Sunday, January 1, 2017 | 3839600000 | 4936500000 |
| Monday, January 1, 2018 | 3883900000 | 2965100000 |
| Tuesday, January 1, 2019 | 3807200000 | 2957200000 |
| Wednesday, January 1, 2020 | 3634100000 | 3017800000 |
| Friday, January 1, 2021 | 4194100000 | 3764800000 |
| Saturday, January 1, 2022 | 4718400000 | 4121800000 |
| Sunday, January 1, 2023 | 4981900000 | 4104500000 |
| Monday, January 1, 2024 | 5341300000 | 4082800000 |
Data in motion
In the ever-evolving landscape of the HVAC and water solutions industries, Lennox International Inc. and Pentair plc have showcased intriguing revenue trajectories over the past decade. From 2014 to 2023, Lennox International Inc. has demonstrated a robust growth pattern, with revenues surging by approximately 59%, from $3.37 billion to $5.34 billion. This consistent upward trend highlights Lennox's strategic market positioning and resilience.
Conversely, Pentair plc experienced a more volatile revenue journey. Starting at a peak of $7.04 billion in 2014, Pentair's revenue saw fluctuations, notably dipping to $2.96 billion in 2018. However, by 2023, Pentair managed to stabilize its revenue around $4.10 billion, reflecting a strategic recalibration in its business operations.
The data for 2024 is incomplete, indicating potential shifts or strategic changes on the horizon. These insights provide a compelling narrative of adaptation and growth in competitive markets.
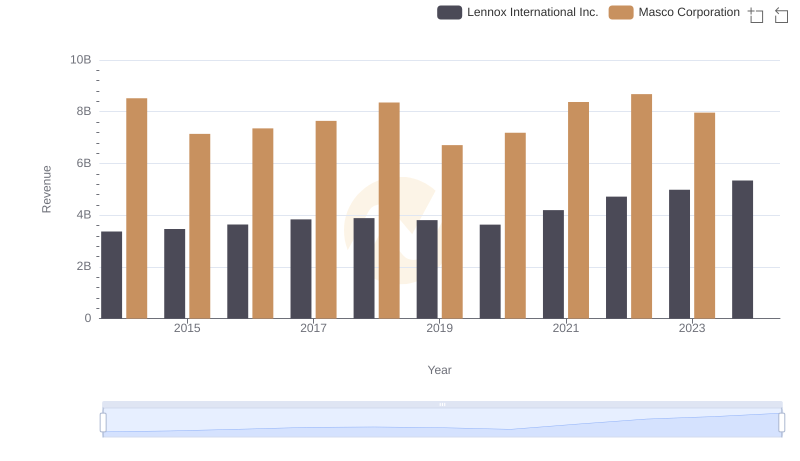
Lennox International Inc. vs Masco Corporation: Annual Revenue Growth Compared
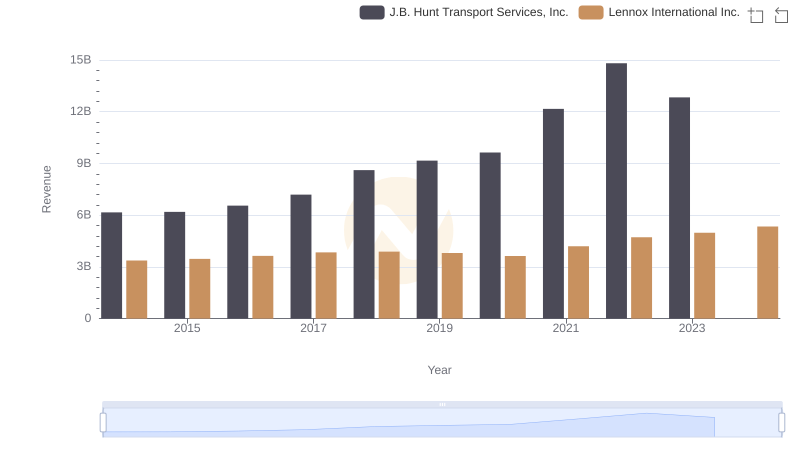
Lennox International Inc. or J.B. Hunt Transport Services, Inc.: Who Leads in Yearly Revenue?
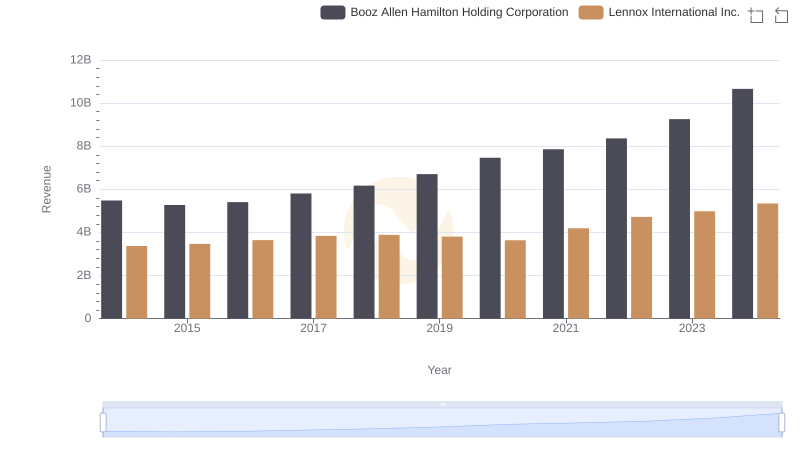
Comparing Revenue Performance: Lennox International Inc. or Booz Allen Hamilton Holding Corporation?
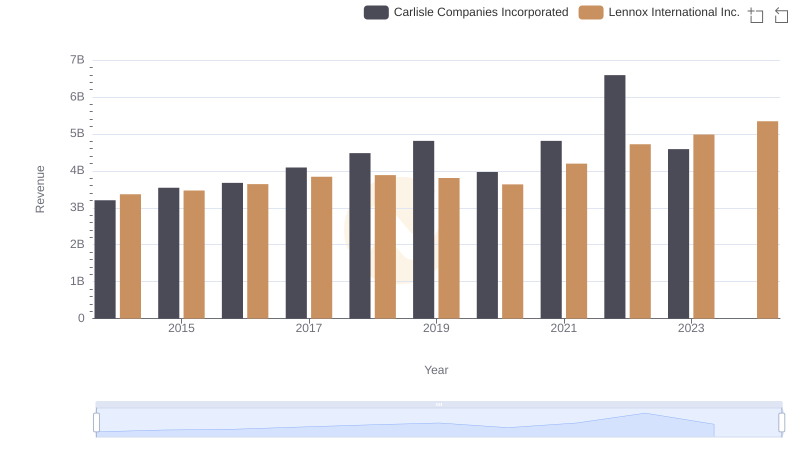
Lennox International Inc. or Carlisle Companies Incorporated: Who Leads in Yearly Revenue?
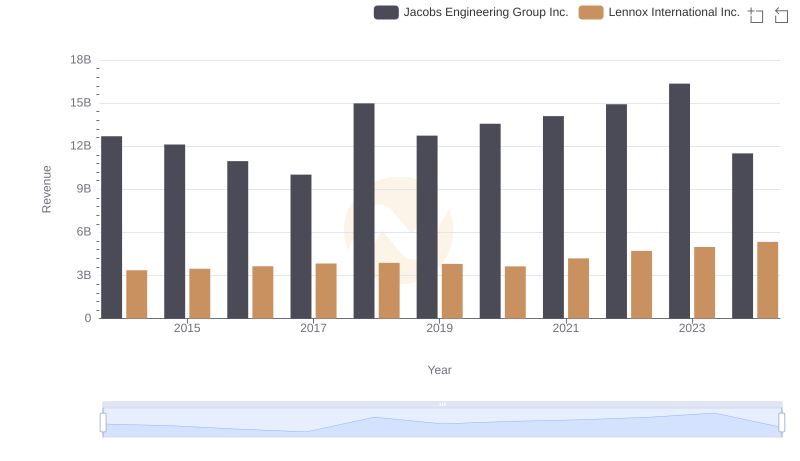
Revenue Showdown: Lennox International Inc. vs Jacobs Engineering Group Inc.
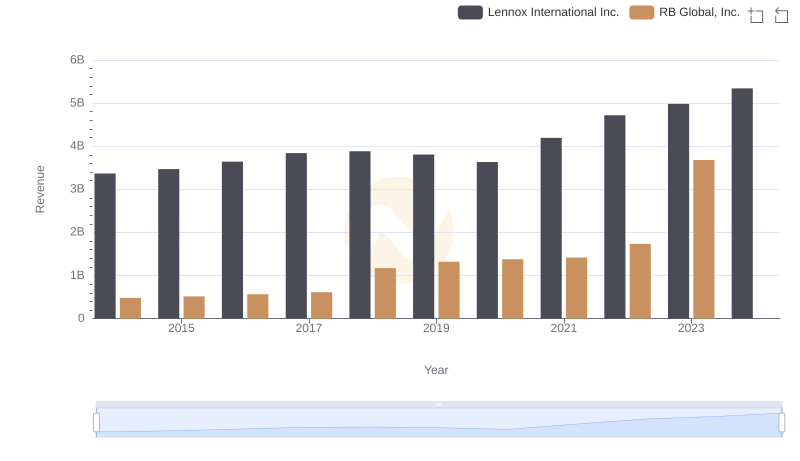
Comparing Revenue Performance: Lennox International Inc. or RB Global, Inc.?
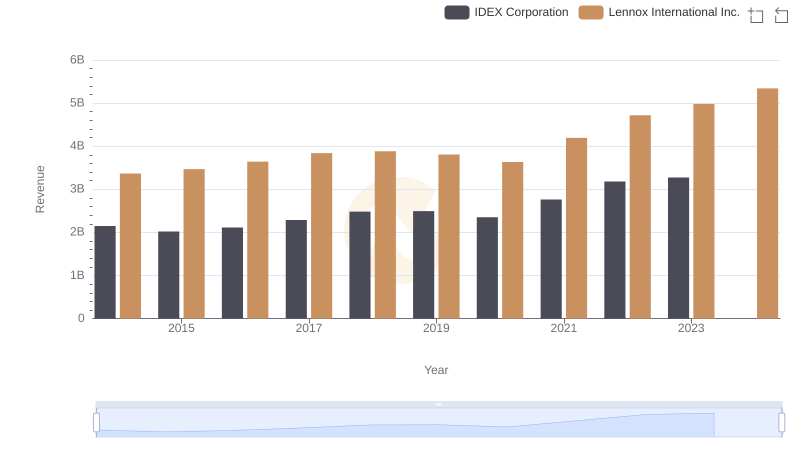
Who Generates More Revenue? Lennox International Inc. or IDEX Corporation
Cost Insights: Breaking Down Lennox International Inc. and Pentair plc's Expenses
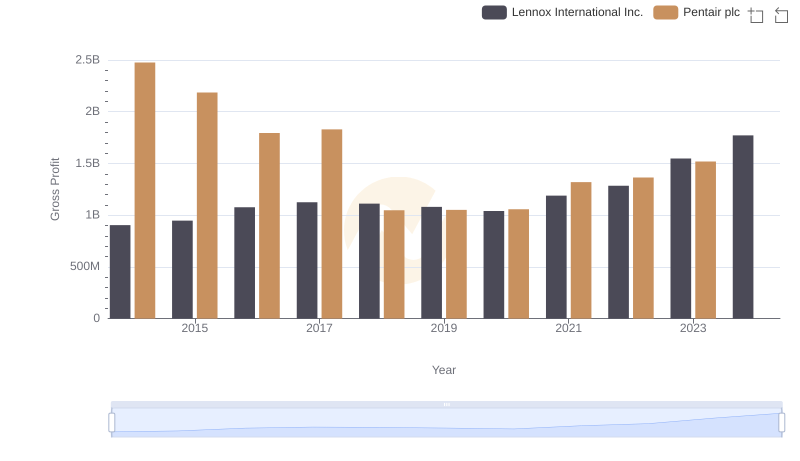
Gross Profit Analysis: Comparing Lennox International Inc. and Pentair plc
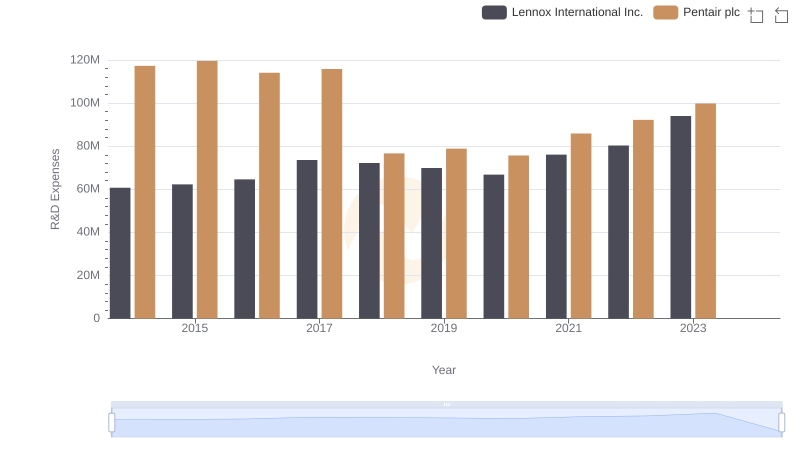
Lennox International Inc. vs Pentair plc: Strategic Focus on R&D Spending
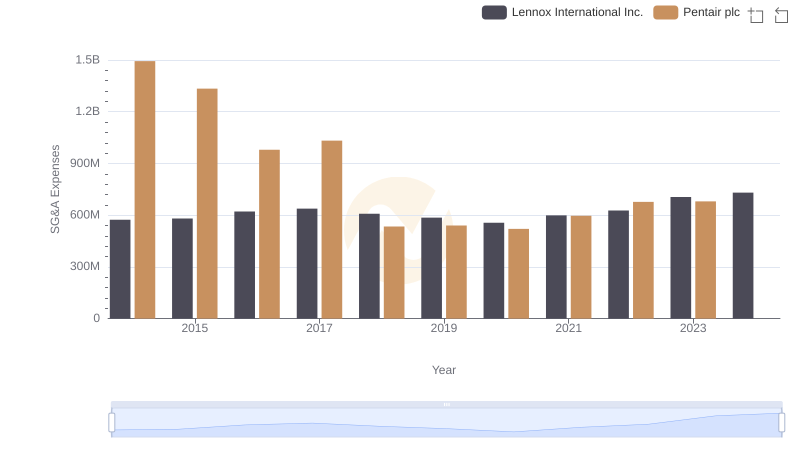
Lennox International Inc. and Pentair plc: SG&A Spending Patterns Compared
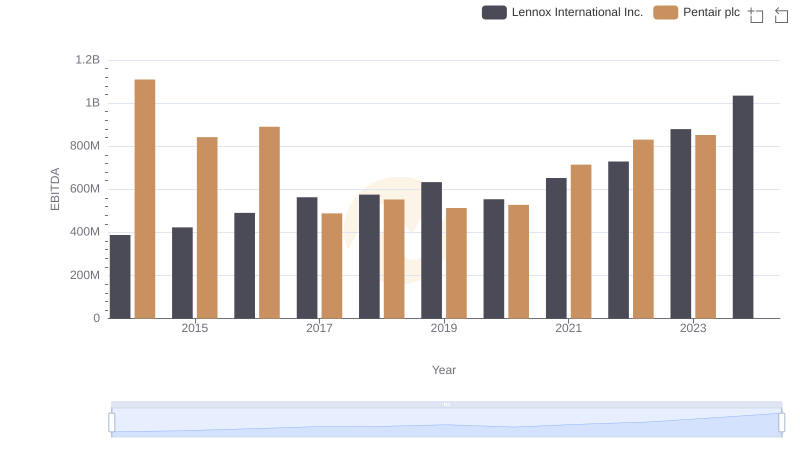
Comparative EBITDA Analysis: Lennox International Inc. vs Pentair plc