| __timestamp | Lennox International Inc. | Pentair plc |
|---|---|---|
| Wednesday, January 1, 2014 | 573700000 | 1493800000 |
| Thursday, January 1, 2015 | 580500000 | 1334300000 |
| Friday, January 1, 2016 | 621000000 | 979300000 |
| Sunday, January 1, 2017 | 637700000 | 1032500000 |
| Monday, January 1, 2018 | 608200000 | 534300000 |
| Tuesday, January 1, 2019 | 585900000 | 540100000 |
| Wednesday, January 1, 2020 | 555900000 | 520500000 |
| Friday, January 1, 2021 | 598900000 | 596400000 |
| Saturday, January 1, 2022 | 627200000 | 677100000 |
| Sunday, January 1, 2023 | 705500000 | 680200000 |
| Monday, January 1, 2024 | 730600000 | 701400000 |
Infusing magic into the data realm
In the ever-evolving landscape of corporate finance, understanding the nuances of Selling, General, and Administrative (SG&A) expenses is crucial. From 2014 to 2023, Lennox International Inc. and Pentair plc have showcased distinct spending patterns. Lennox International's SG&A expenses have steadily increased by approximately 27%, peaking in 2023. In contrast, Pentair plc experienced a significant decline of around 55% from 2014 to 2020, followed by a modest recovery. This divergence highlights Lennox's consistent investment in operational efficiency, while Pentair's fluctuating expenses suggest strategic realignments. Notably, data for Pentair in 2024 is missing, indicating potential reporting delays or strategic shifts. As businesses navigate economic uncertainties, these insights into SG&A trends offer valuable lessons in financial management and strategic planning.
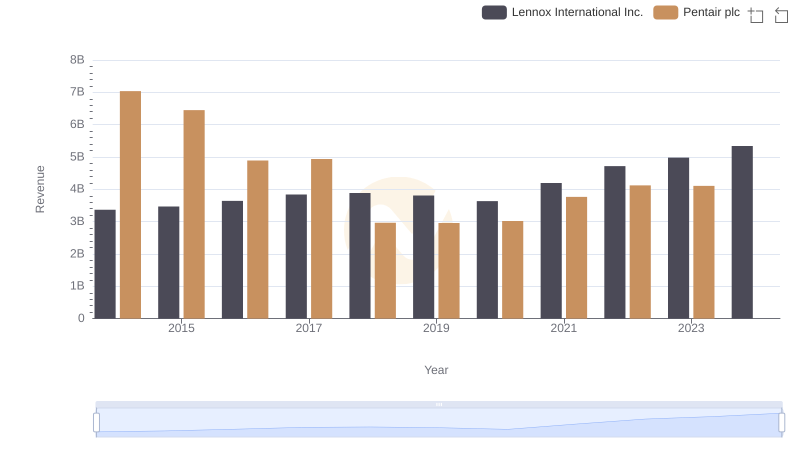
Lennox International Inc. and Pentair plc: A Comprehensive Revenue Analysis
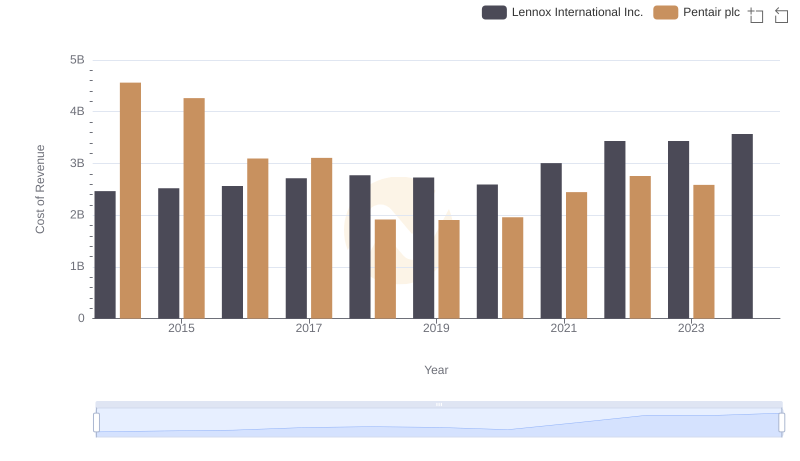
Cost Insights: Breaking Down Lennox International Inc. and Pentair plc's Expenses
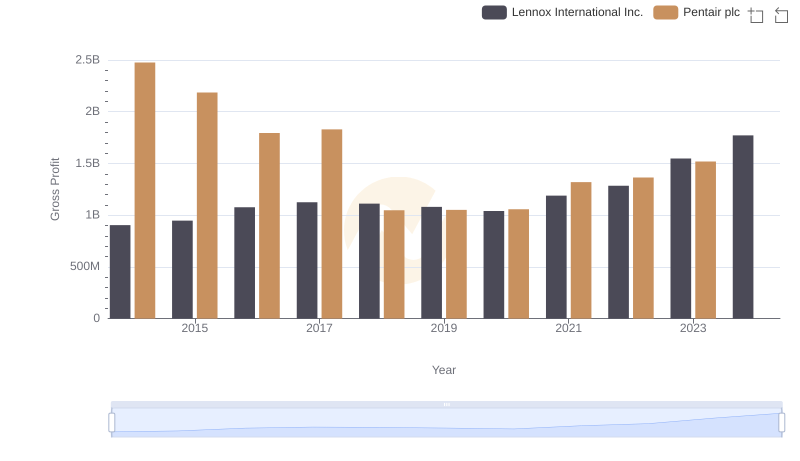
Gross Profit Analysis: Comparing Lennox International Inc. and Pentair plc
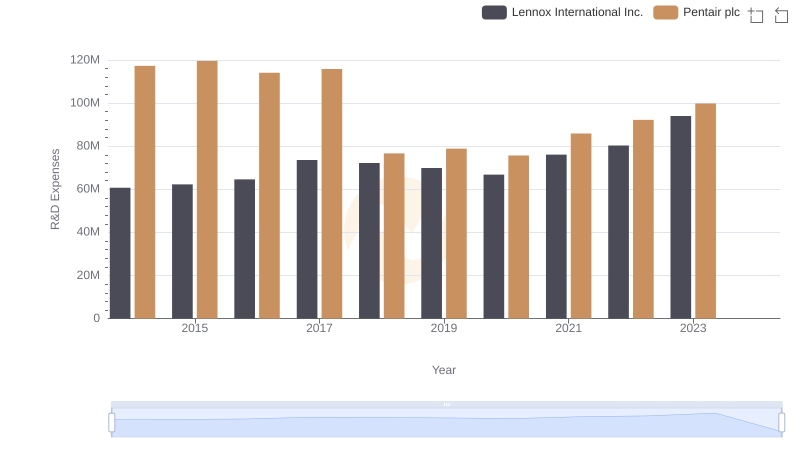
Lennox International Inc. vs Pentair plc: Strategic Focus on R&D Spending
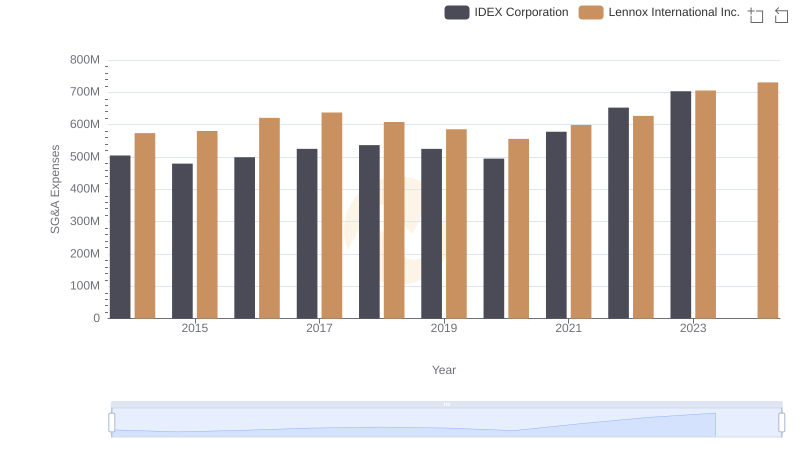
Lennox International Inc. vs IDEX Corporation: SG&A Expense Trends
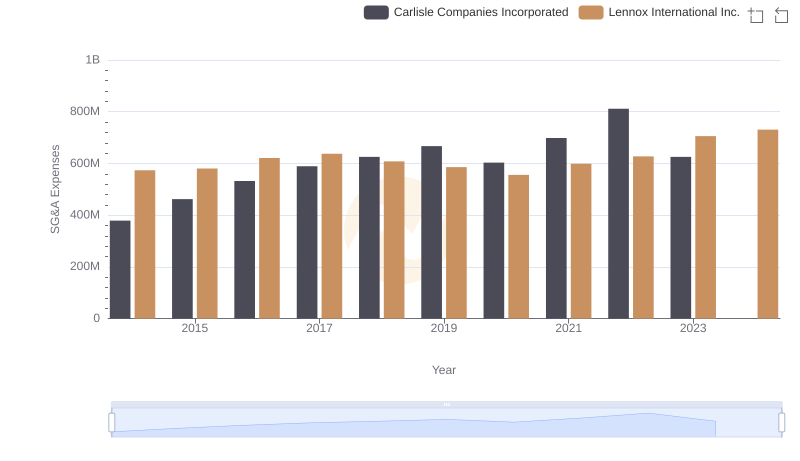
Selling, General, and Administrative Costs: Lennox International Inc. vs Carlisle Companies Incorporated
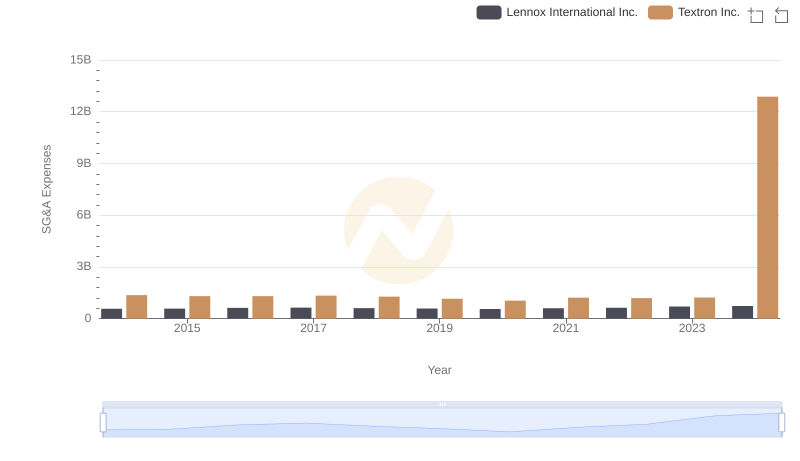
Lennox International Inc. or Textron Inc.: Who Manages SG&A Costs Better?
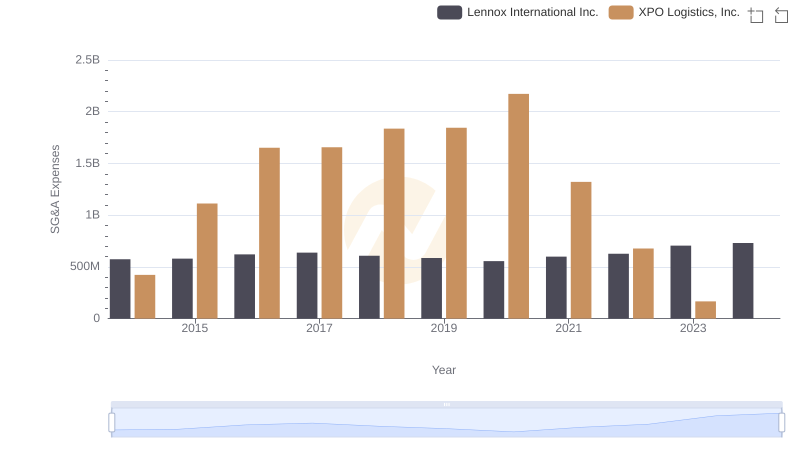
Lennox International Inc. vs XPO Logistics, Inc.: SG&A Expense Trends
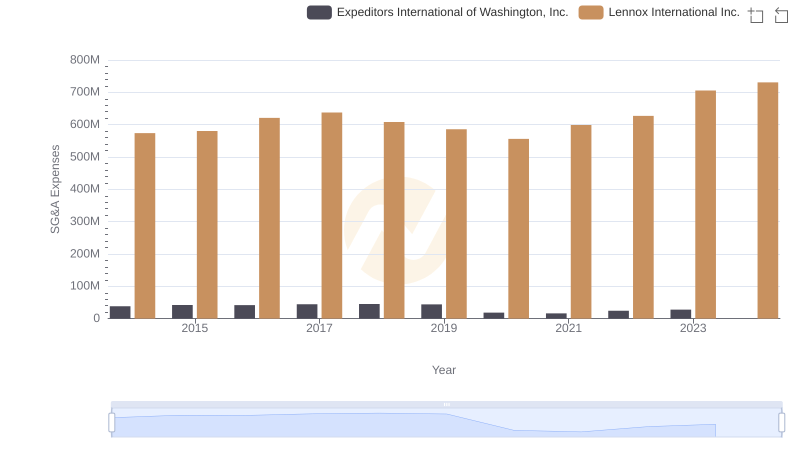
SG&A Efficiency Analysis: Comparing Lennox International Inc. and Expeditors International of Washington, Inc.
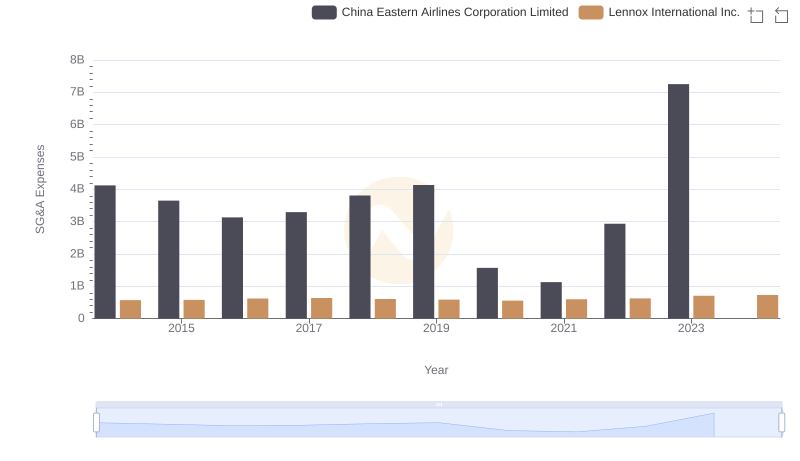
Lennox International Inc. and China Eastern Airlines Corporation Limited: SG&A Spending Patterns Compared
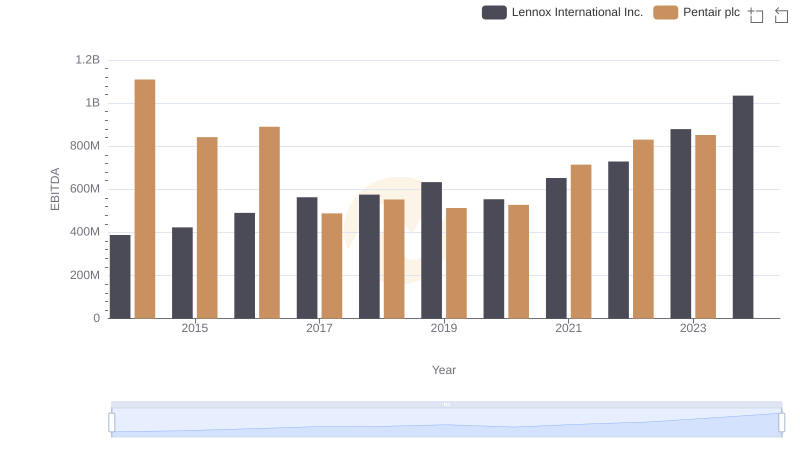
Comparative EBITDA Analysis: Lennox International Inc. vs Pentair plc
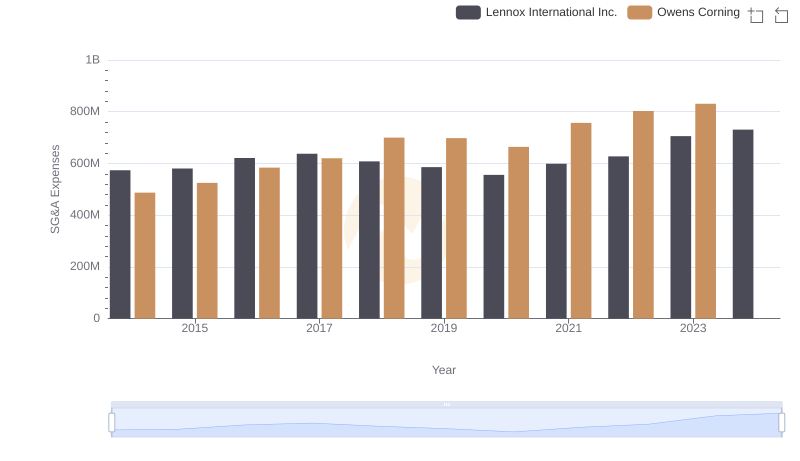
Lennox International Inc. or Owens Corning: Who Manages SG&A Costs Better?