| __timestamp | Graco Inc. | Lennox International Inc. |
|---|---|---|
| Wednesday, January 1, 2014 | 1221130000 | 3367400000 |
| Thursday, January 1, 2015 | 1286485000 | 3467400000 |
| Friday, January 1, 2016 | 1329293000 | 3641600000 |
| Sunday, January 1, 2017 | 1474744000 | 3839600000 |
| Monday, January 1, 2018 | 1653292000 | 3883900000 |
| Tuesday, January 1, 2019 | 1646045000 | 3807200000 |
| Wednesday, January 1, 2020 | 1650115000 | 3634100000 |
| Friday, January 1, 2021 | 1987608000 | 4194100000 |
| Saturday, January 1, 2022 | 2143521000 | 4718400000 |
| Sunday, January 1, 2023 | 2195606000 | 4981900000 |
| Monday, January 1, 2024 | 2113316000 | 5341300000 |
Infusing magic into the data realm
In the competitive landscape of industrial manufacturing, Lennox International Inc. and Graco Inc. have showcased remarkable revenue trajectories over the past decade. From 2014 to 2024, Lennox International Inc. has consistently outperformed Graco Inc., with revenues peaking at approximately $5.34 billion in 2024, marking a 59% increase from 2014. Meanwhile, Graco Inc. has demonstrated steady growth, reaching around $2.11 billion in 2024, a 73% rise from its 2014 figures.
Lennox's robust growth can be attributed to its strategic expansions and innovations in climate control solutions, while Graco's steady climb reflects its stronghold in fluid handling systems. As we look towards the future, these trends highlight the dynamic nature of the industrial sector and the importance of strategic positioning in maintaining competitive advantage.
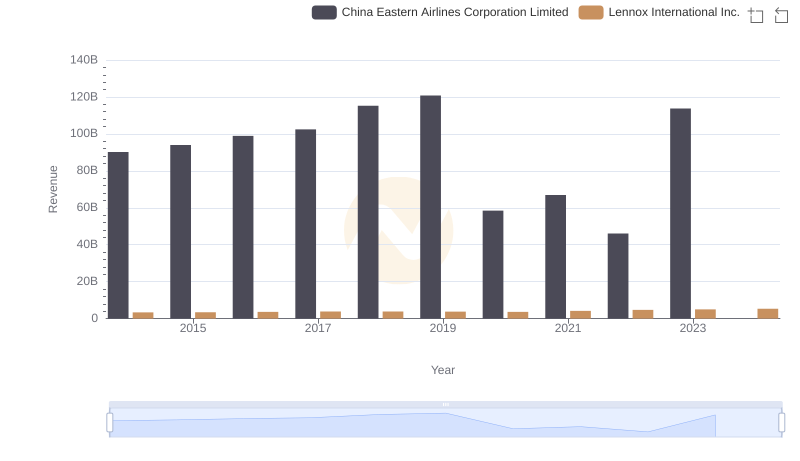
Revenue Insights: Lennox International Inc. and China Eastern Airlines Corporation Limited Performance Compared
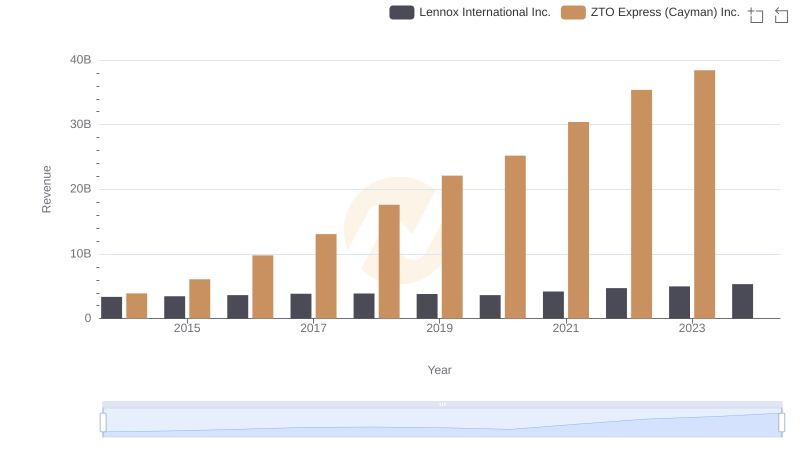
Lennox International Inc. and ZTO Express (Cayman) Inc.: A Comprehensive Revenue Analysis
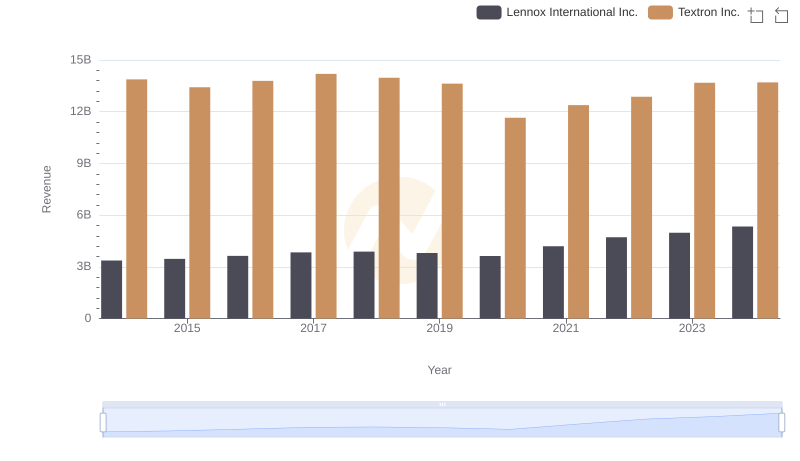
Lennox International Inc. vs Textron Inc.: Annual Revenue Growth Compared
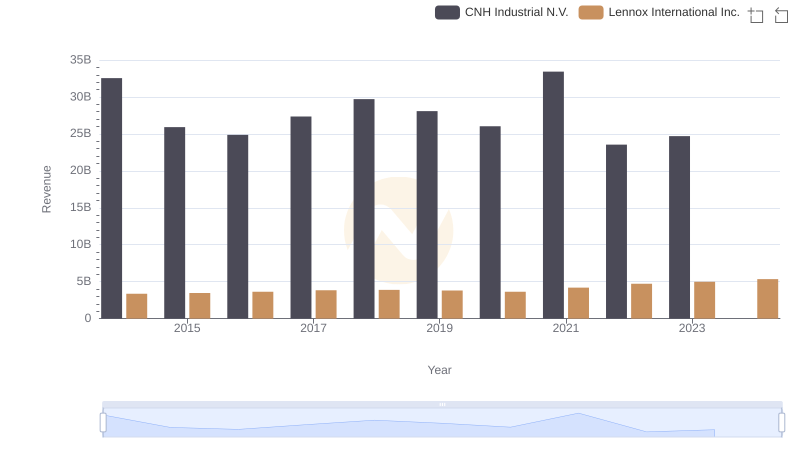
Lennox International Inc. and CNH Industrial N.V.: A Comprehensive Revenue Analysis
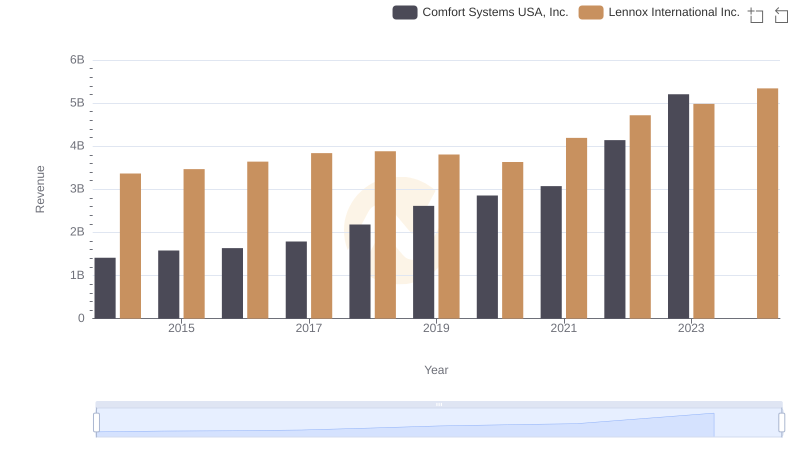
Lennox International Inc. vs Comfort Systems USA, Inc.: Annual Revenue Growth Compared
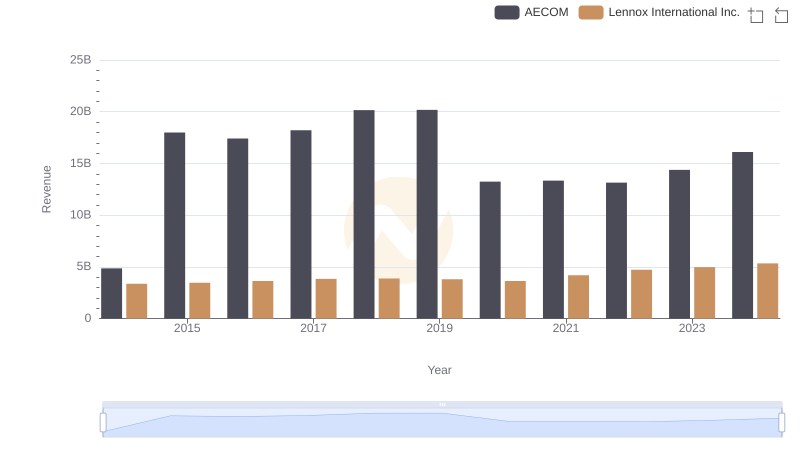
Lennox International Inc. vs AECOM: Examining Key Revenue Metrics
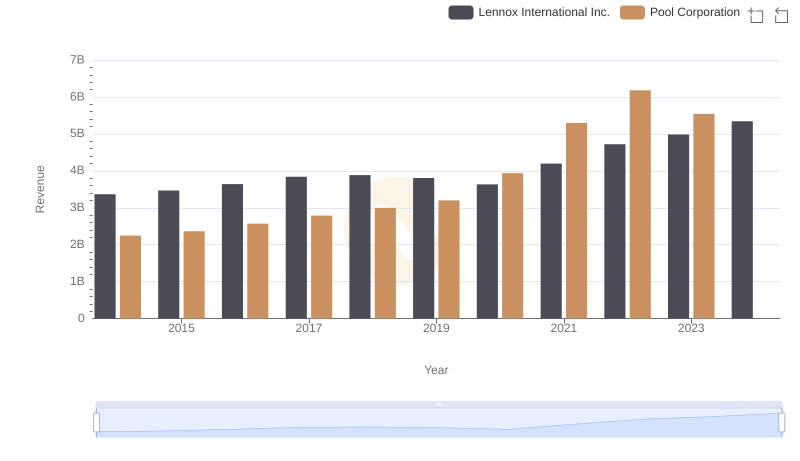
Lennox International Inc. vs Pool Corporation: Annual Revenue Growth Compared
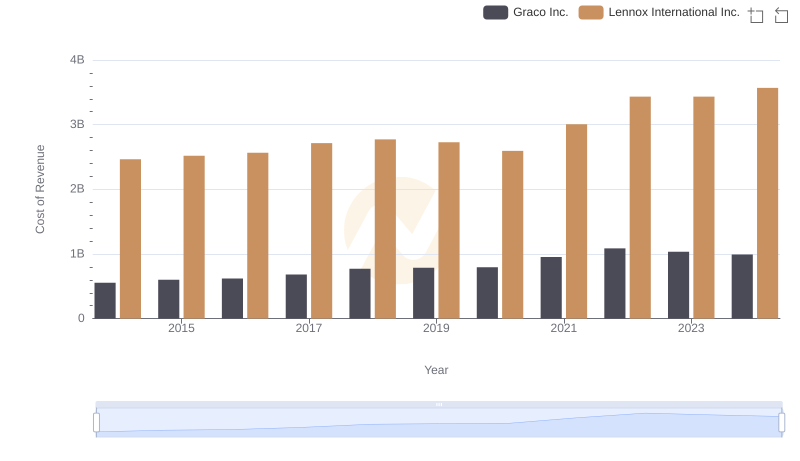
Cost of Revenue Comparison: Lennox International Inc. vs Graco Inc.
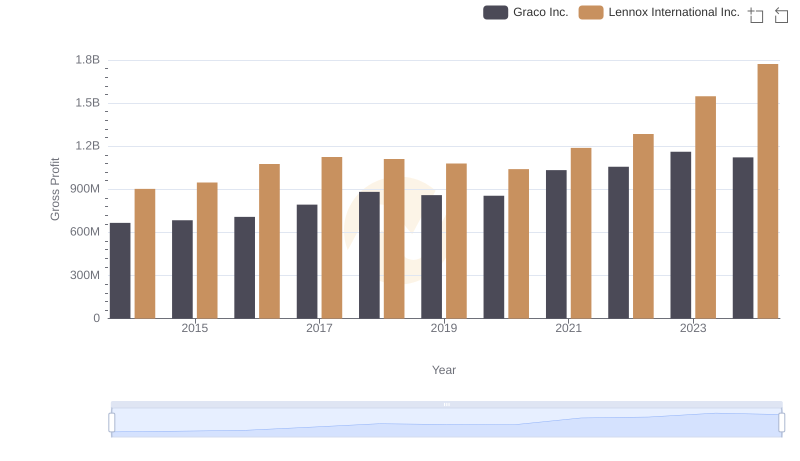
Lennox International Inc. and Graco Inc.: A Detailed Gross Profit Analysis
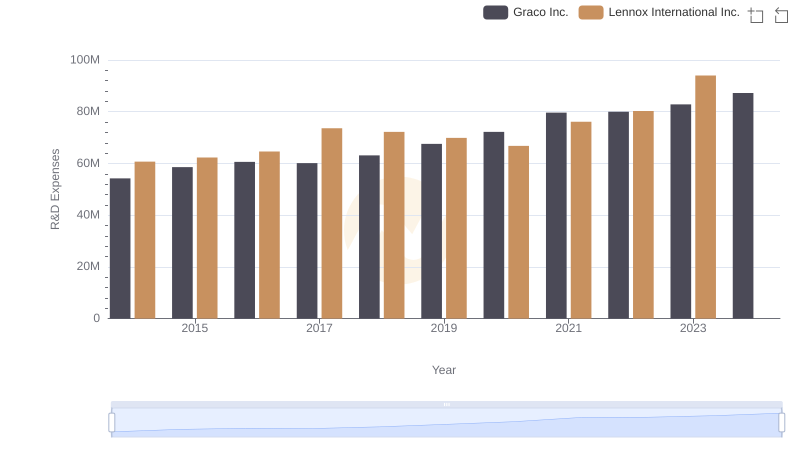
Lennox International Inc. or Graco Inc.: Who Invests More in Innovation?
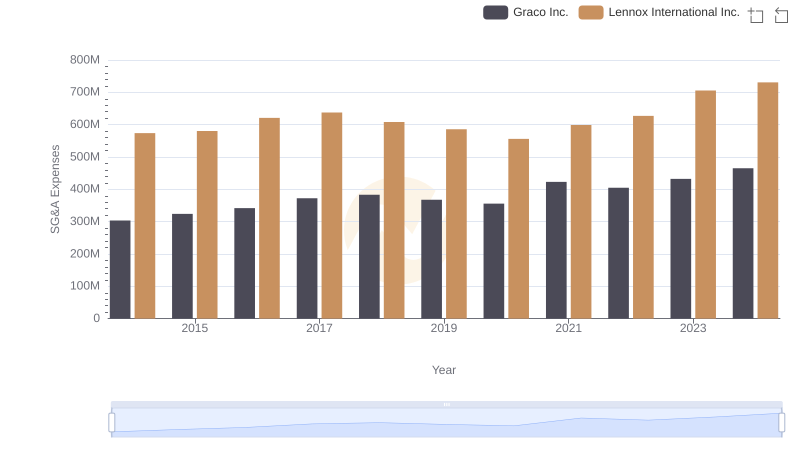
Who Optimizes SG&A Costs Better? Lennox International Inc. or Graco Inc.
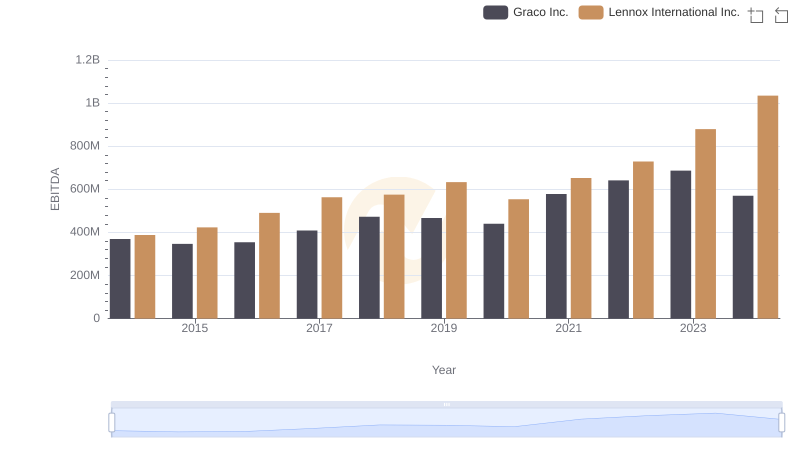
Comparative EBITDA Analysis: Lennox International Inc. vs Graco Inc.