| __timestamp | Graco Inc. | Lennox International Inc. |
|---|---|---|
| Wednesday, January 1, 2014 | 554394000 | 2464100000 |
| Thursday, January 1, 2015 | 601785000 | 2520000000 |
| Friday, January 1, 2016 | 621054000 | 2565100000 |
| Sunday, January 1, 2017 | 681695000 | 2714400000 |
| Monday, January 1, 2018 | 770753000 | 2772700000 |
| Tuesday, January 1, 2019 | 786289000 | 2727400000 |
| Wednesday, January 1, 2020 | 795178000 | 2594000000 |
| Friday, January 1, 2021 | 953659000 | 3005700000 |
| Saturday, January 1, 2022 | 1086082000 | 3433700000 |
| Sunday, January 1, 2023 | 1034585000 | 3434100000 |
| Monday, January 1, 2024 | 990855000 | 3569400000 |
Data in motion
In the competitive landscape of industrial manufacturing, Lennox International Inc. and Graco Inc. have carved out significant niches. Over the past decade, Lennox International has consistently outpaced Graco in terms of cost of revenue, with figures often more than three times higher. This trend highlights Lennox's expansive operations and market reach.
From 2014 to 2024, Lennox's cost of revenue surged by approximately 45%, peaking in 2024. In contrast, Graco's cost of revenue grew by about 79% over the same period, reflecting its strategic expansions and operational efficiencies.
The early 2020s marked a pivotal era, with both companies experiencing significant growth. By 2023, Lennox's cost of revenue reached a staggering 3.43 billion, while Graco's hit 1.03 billion, showcasing their resilience and adaptability in a dynamic market.
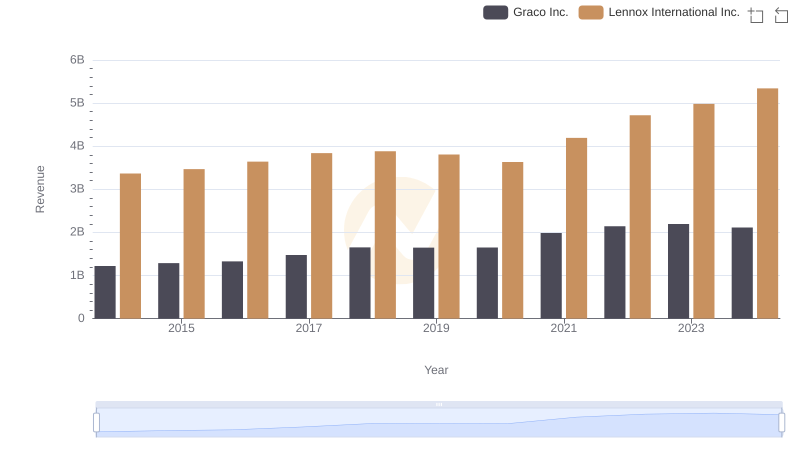
Revenue Showdown: Lennox International Inc. vs Graco Inc.
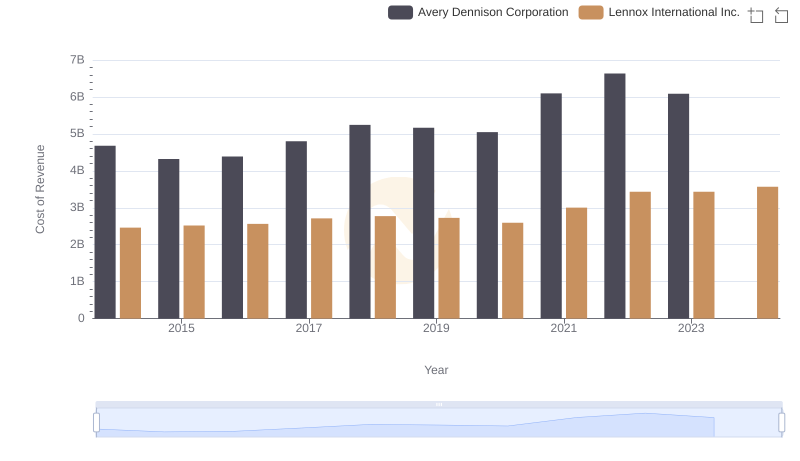
Cost of Revenue Comparison: Lennox International Inc. vs Avery Dennison Corporation
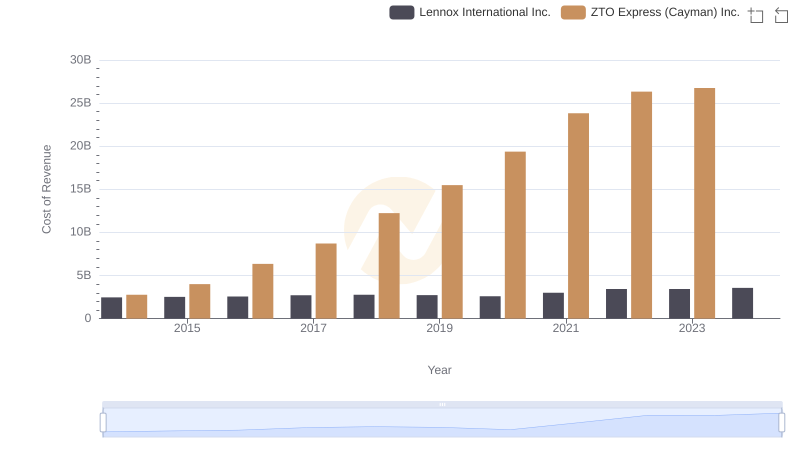
Lennox International Inc. vs ZTO Express (Cayman) Inc.: Efficiency in Cost of Revenue Explored
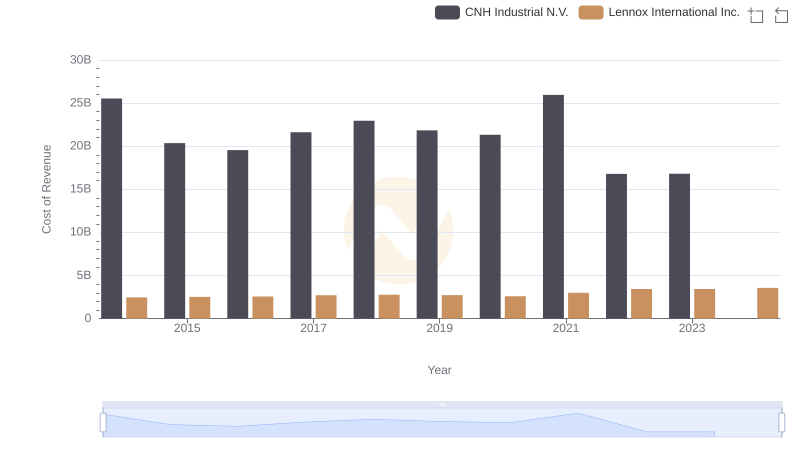
Cost of Revenue Trends: Lennox International Inc. vs CNH Industrial N.V.
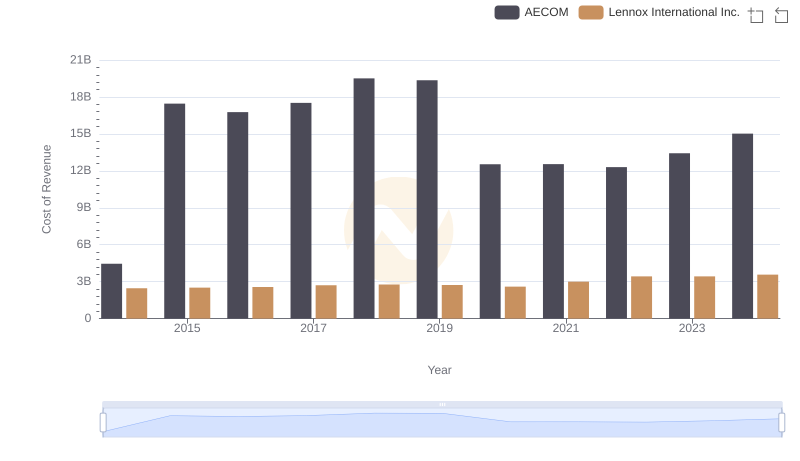
Cost of Revenue Trends: Lennox International Inc. vs AECOM
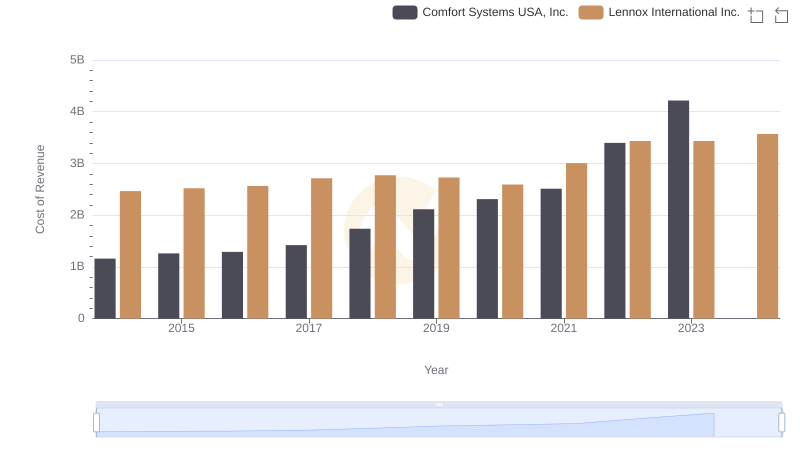
Cost of Revenue Trends: Lennox International Inc. vs Comfort Systems USA, Inc.
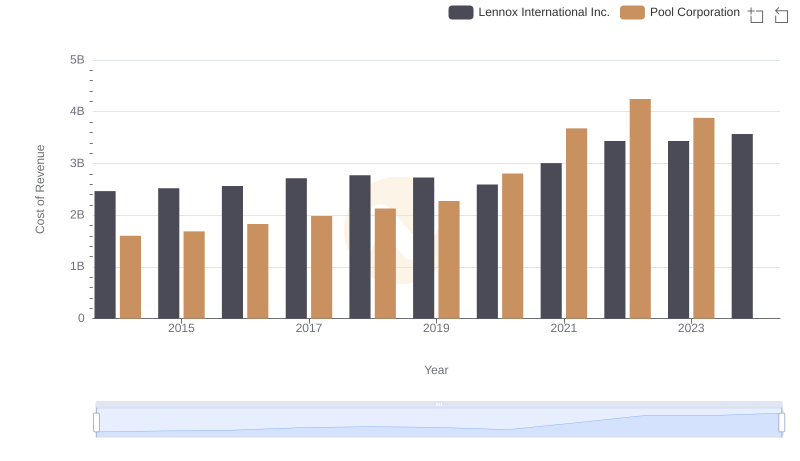
Comparing Cost of Revenue Efficiency: Lennox International Inc. vs Pool Corporation
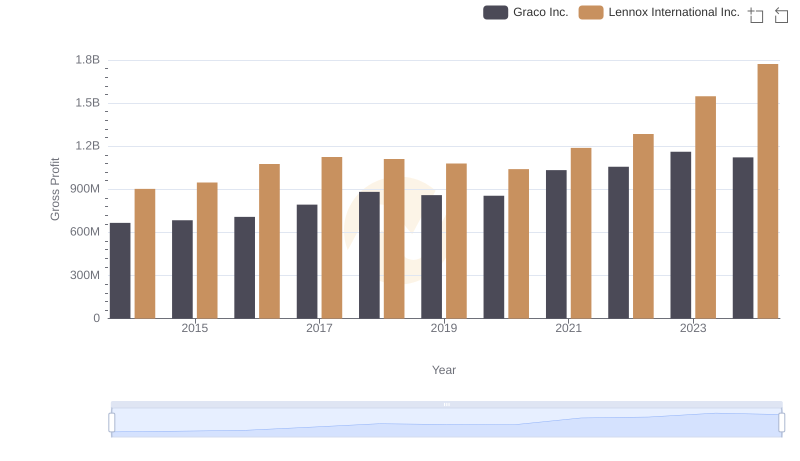
Lennox International Inc. and Graco Inc.: A Detailed Gross Profit Analysis
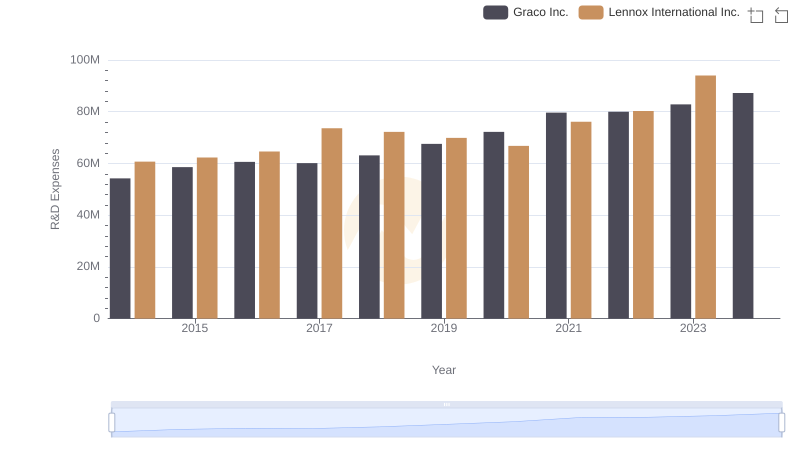
Lennox International Inc. or Graco Inc.: Who Invests More in Innovation?
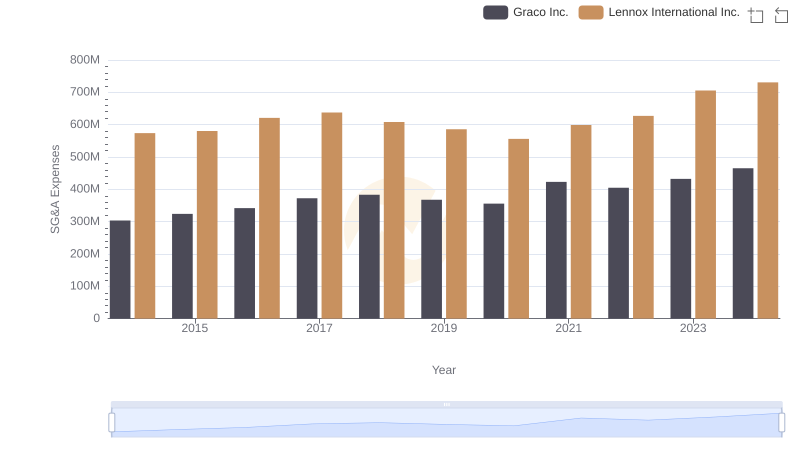
Who Optimizes SG&A Costs Better? Lennox International Inc. or Graco Inc.
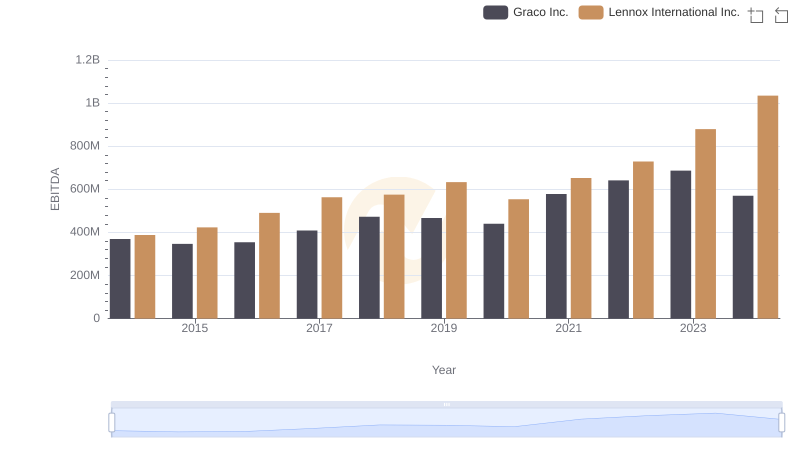
Comparative EBITDA Analysis: Lennox International Inc. vs Graco Inc.