| __timestamp | CGI Inc. | Cisco Systems, Inc. |
|---|---|---|
| Wednesday, January 1, 2014 | 2236386000 | 27769000000 |
| Thursday, January 1, 2015 | 2306911000 | 29681000000 |
| Friday, January 1, 2016 | 2389857000 | 30960000000 |
| Sunday, January 1, 2017 | 2344241000 | 30224000000 |
| Monday, January 1, 2018 | 2461165000 | 30606000000 |
| Tuesday, January 1, 2019 | 2639575000 | 32666000000 |
| Wednesday, January 1, 2020 | 2743715000 | 31683000000 |
| Friday, January 1, 2021 | 2716822000 | 31894000000 |
| Saturday, January 1, 2022 | 2819052000 | 32248000000 |
| Sunday, January 1, 2023 | 2313939000 | 35753000000 |
| Monday, January 1, 2024 | 2416422000 | 34828000000 |
Cracking the code
In the ever-evolving tech industry, understanding financial performance is crucial. This analysis delves into the gross profit trends of two industry giants, Cisco Systems, Inc. and CGI Inc., from 2014 to 2024. Over this decade, Cisco consistently outperformed CGI, with its gross profit peaking at approximately $35.8 billion in 2023, a 29% increase from 2014. In contrast, CGI's gross profit showed a steady growth, reaching around $2.8 billion in 2022, marking a 26% rise from its 2014 figures. Notably, Cisco's gross profit in 2023 was over ten times that of CGI, highlighting its dominant market position. This data underscores the importance of strategic financial management in maintaining competitive advantage in the tech sector.
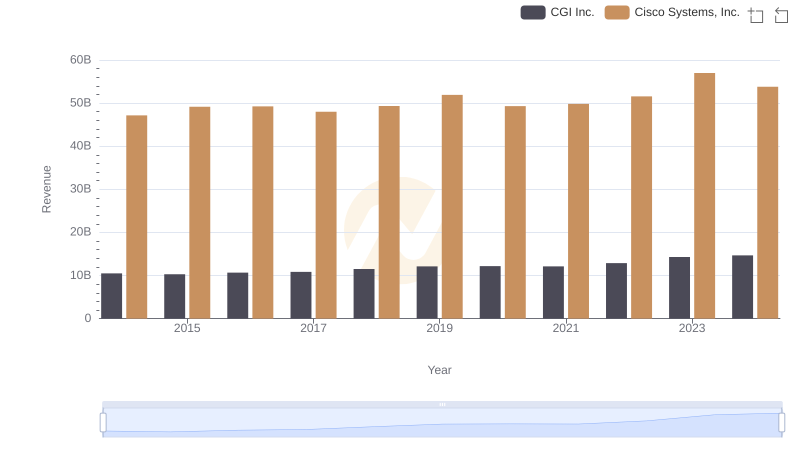
Revenue Insights: Cisco Systems, Inc. and CGI Inc. Performance Compared
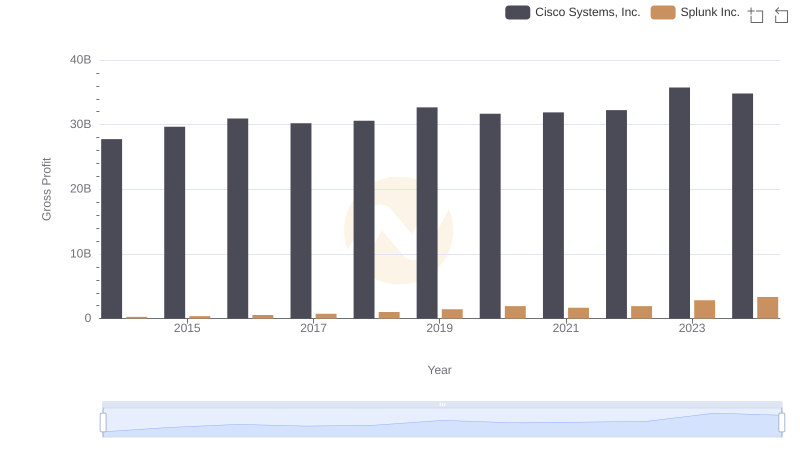
Gross Profit Comparison: Cisco Systems, Inc. and Splunk Inc. Trends
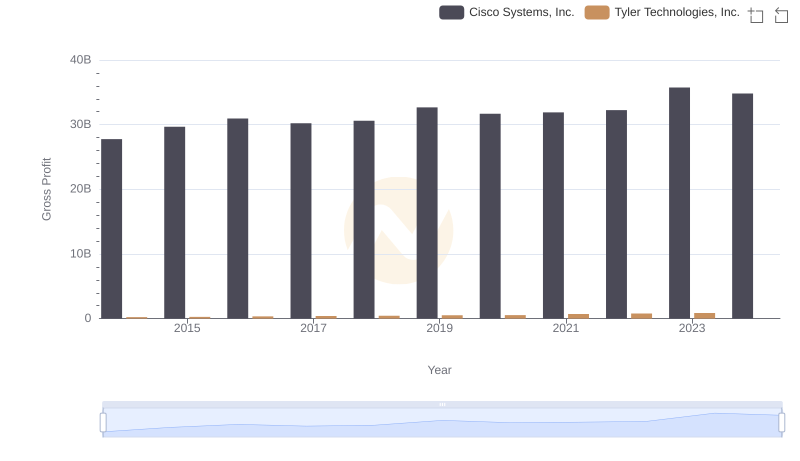
Gross Profit Analysis: Comparing Cisco Systems, Inc. and Tyler Technologies, Inc.
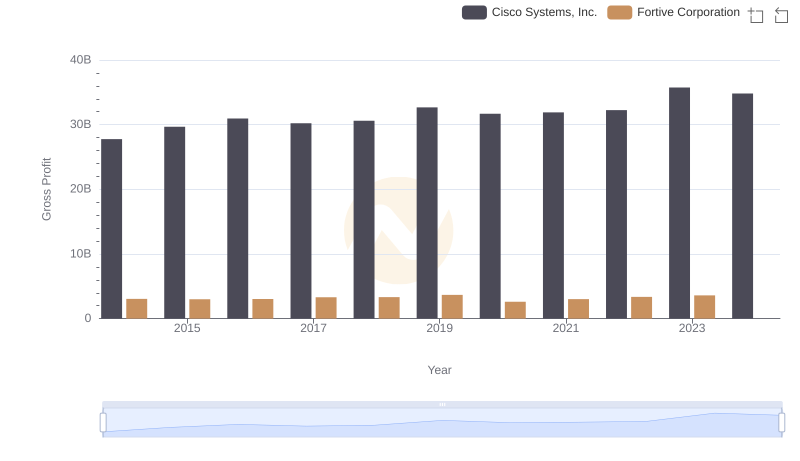
Key Insights on Gross Profit: Cisco Systems, Inc. vs Fortive Corporation
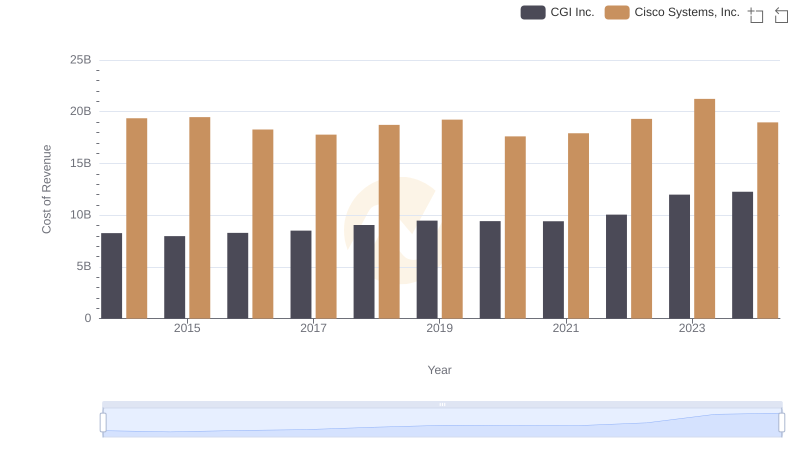
Cisco Systems, Inc. vs CGI Inc.: Efficiency in Cost of Revenue Explored
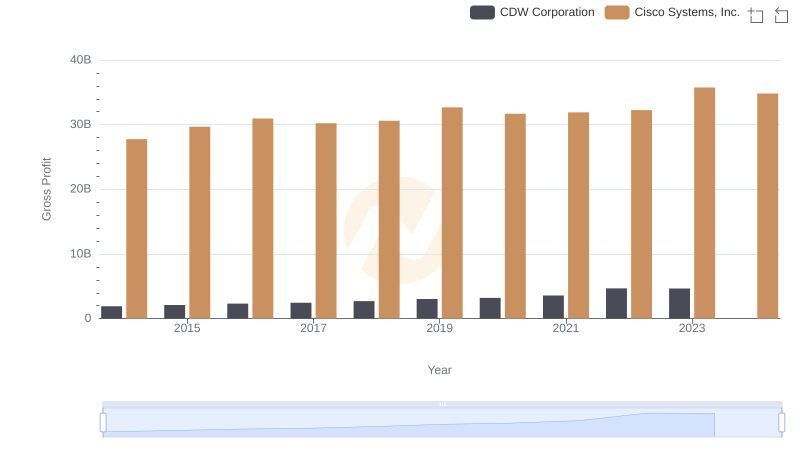
Cisco Systems, Inc. vs CDW Corporation: A Gross Profit Performance Breakdown
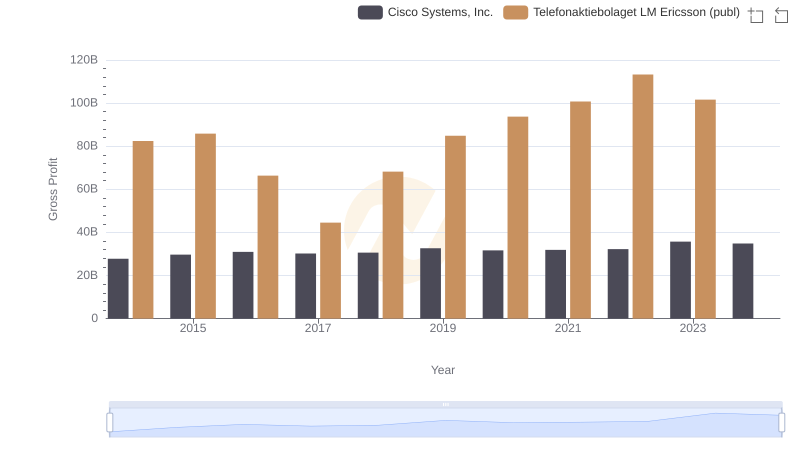
Cisco Systems, Inc. vs Telefonaktiebolaget LM Ericsson (publ): A Gross Profit Performance Breakdown
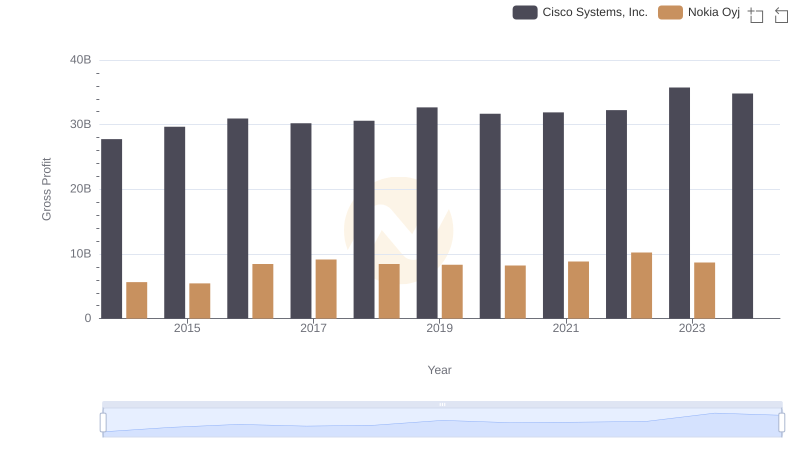
Gross Profit Comparison: Cisco Systems, Inc. and Nokia Oyj Trends
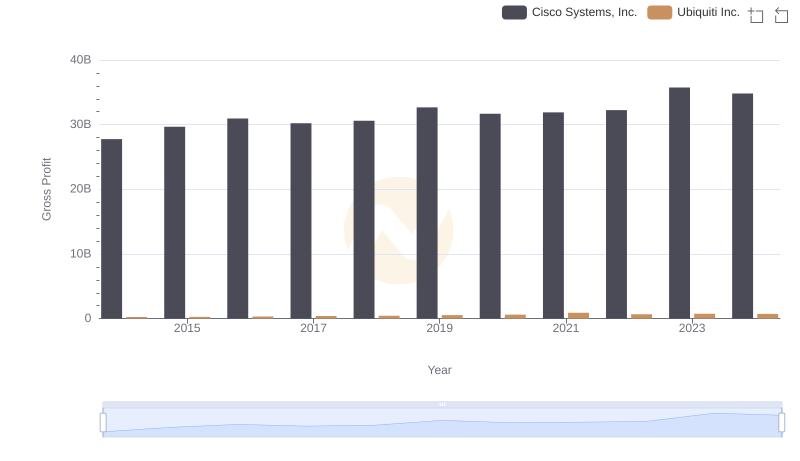
Cisco Systems, Inc. and Ubiquiti Inc.: A Detailed Gross Profit Analysis
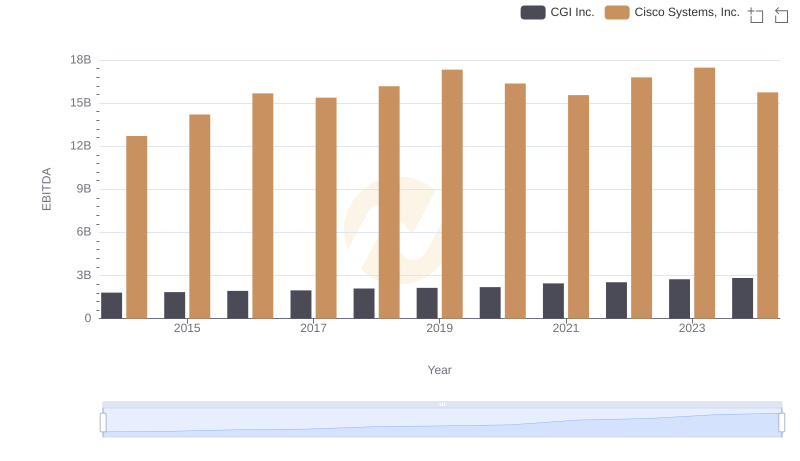
EBITDA Analysis: Evaluating Cisco Systems, Inc. Against CGI Inc.
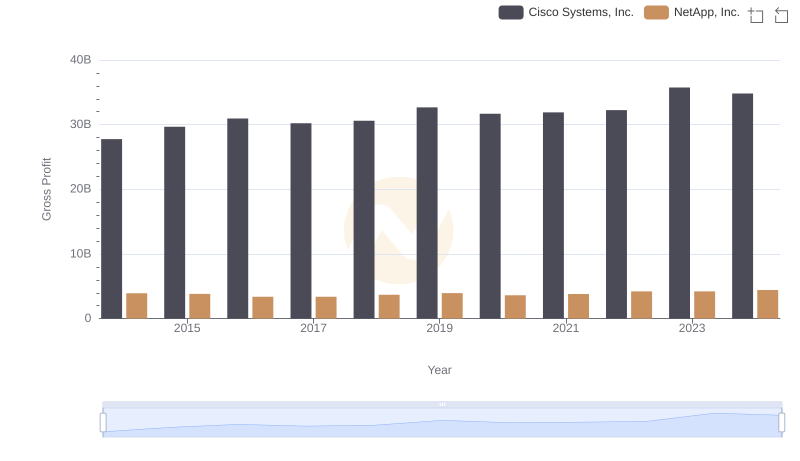
Gross Profit Analysis: Comparing Cisco Systems, Inc. and NetApp, Inc.
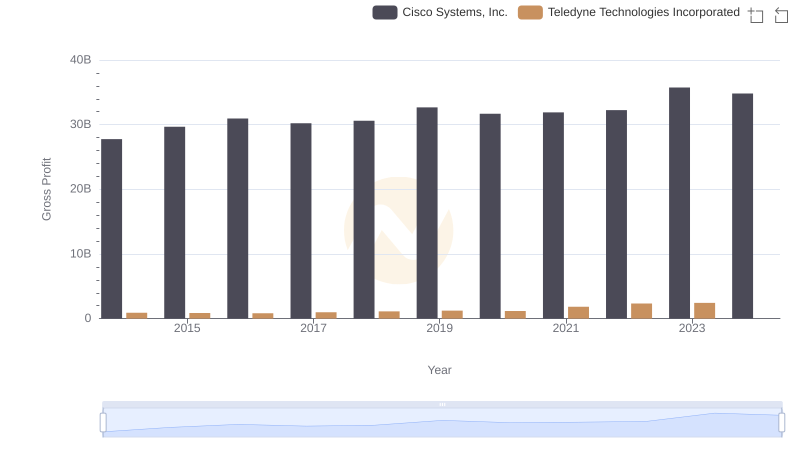
Gross Profit Trends Compared: Cisco Systems, Inc. vs Teledyne Technologies Incorporated