| __timestamp | CGI Inc. | Cisco Systems, Inc. |
|---|---|---|
| Wednesday, January 1, 2014 | 1813301000 | 12709000000 |
| Thursday, January 1, 2015 | 1845401000 | 14209000000 |
| Friday, January 1, 2016 | 1929339000 | 15678000000 |
| Sunday, January 1, 2017 | 1962419000 | 15383000000 |
| Monday, January 1, 2018 | 2092453000 | 16172000000 |
| Tuesday, January 1, 2019 | 2136374000 | 17334000000 |
| Wednesday, January 1, 2020 | 2192519000 | 16363000000 |
| Friday, January 1, 2021 | 2451697000 | 15558000000 |
| Saturday, January 1, 2022 | 2528385000 | 16794000000 |
| Sunday, January 1, 2023 | 2736123000 | 17471000000 |
| Monday, January 1, 2024 | 2822924000 | 15747000000 |
Unveiling the hidden dimensions of data
In the ever-evolving tech industry, understanding financial health is crucial. Cisco Systems, Inc. and CGI Inc., two giants in the field, have shown distinct EBITDA trends over the past decade. From 2014 to 2023, Cisco consistently outperformed CGI, with EBITDA figures averaging around $15.8 billion, nearly seven times CGI's average of $2.2 billion. Notably, Cisco's EBITDA peaked in 2023, reaching approximately $17.5 billion, a 37% increase from 2014. Meanwhile, CGI demonstrated steady growth, with a 56% rise in EBITDA from 2014 to 2023, peaking at $2.8 billion in 2024. This analysis highlights Cisco's dominant market position and CGI's consistent growth trajectory. Investors and stakeholders should consider these trends when evaluating potential opportunities in the tech sector.
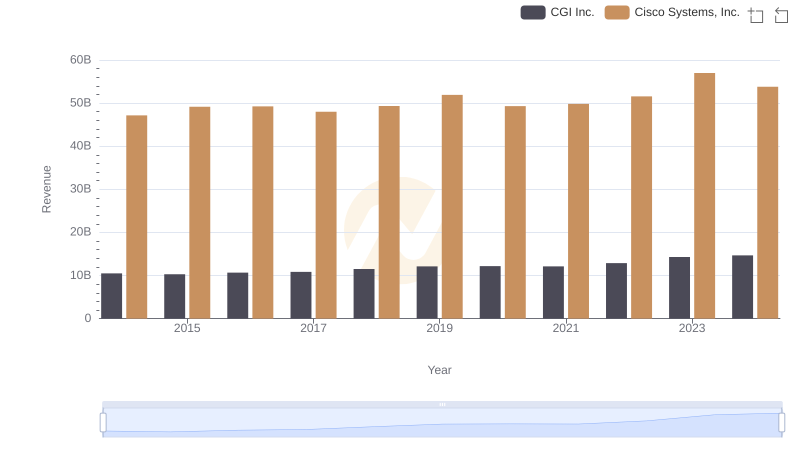
Revenue Insights: Cisco Systems, Inc. and CGI Inc. Performance Compared
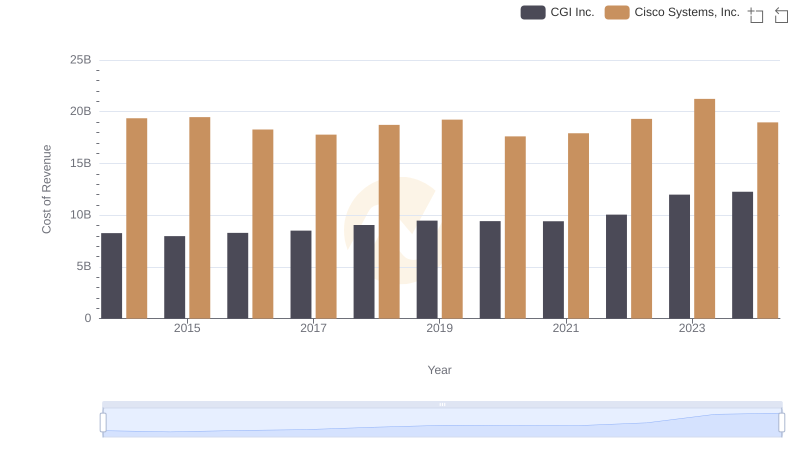
Cisco Systems, Inc. vs CGI Inc.: Efficiency in Cost of Revenue Explored
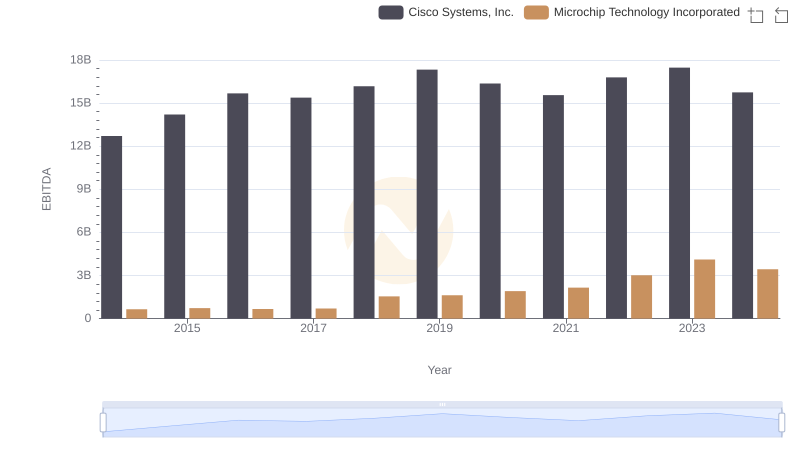
A Side-by-Side Analysis of EBITDA: Cisco Systems, Inc. and Microchip Technology Incorporated

EBITDA Metrics Evaluated: Cisco Systems, Inc. vs Monolithic Power Systems, Inc.
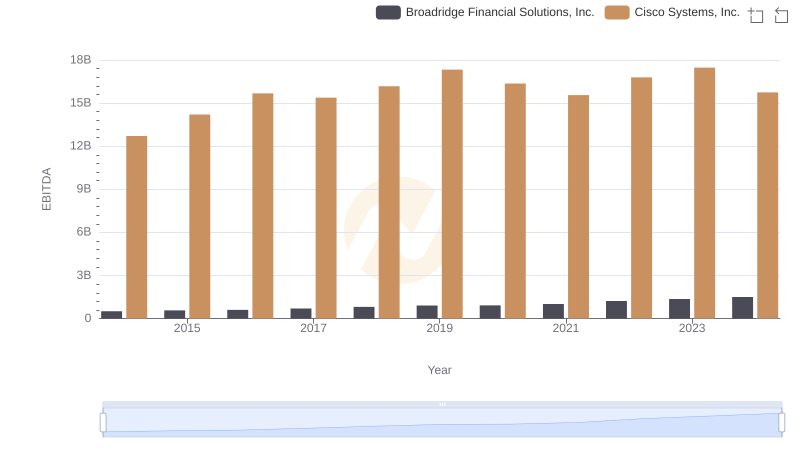
EBITDA Metrics Evaluated: Cisco Systems, Inc. vs Broadridge Financial Solutions, Inc.

EBITDA Performance Review: Cisco Systems, Inc. vs II-VI Incorporated
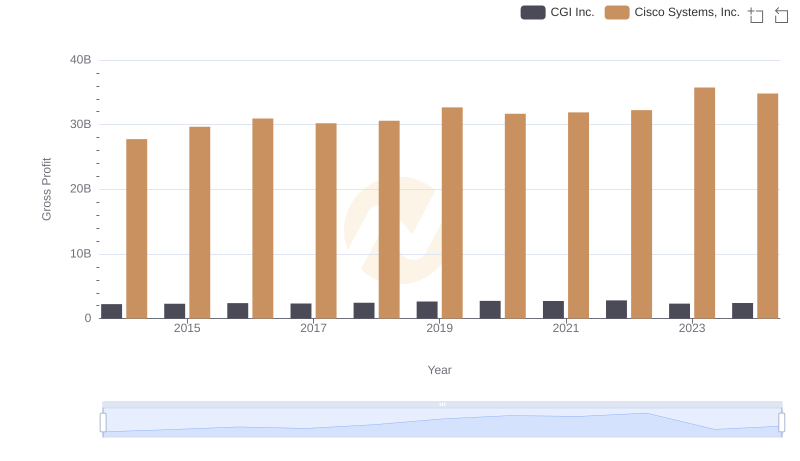
Key Insights on Gross Profit: Cisco Systems, Inc. vs CGI Inc.
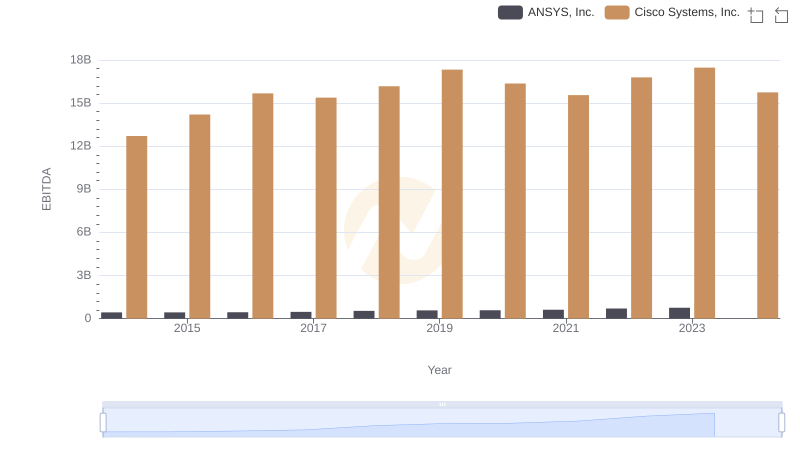
A Side-by-Side Analysis of EBITDA: Cisco Systems, Inc. and ANSYS, Inc.
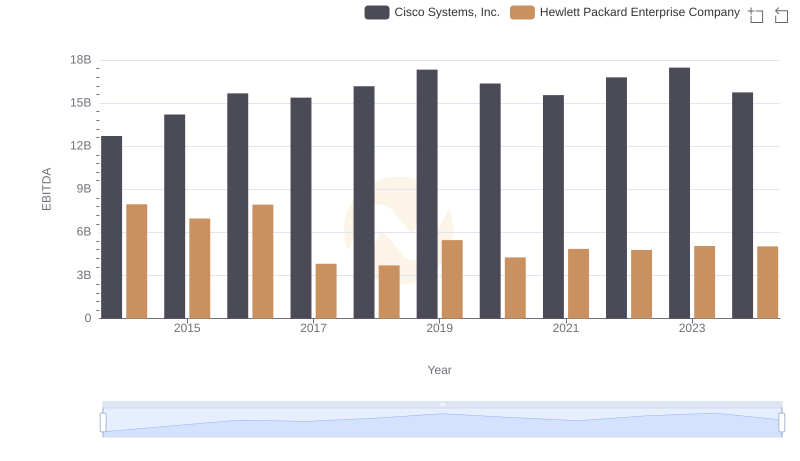
Comparative EBITDA Analysis: Cisco Systems, Inc. vs Hewlett Packard Enterprise Company
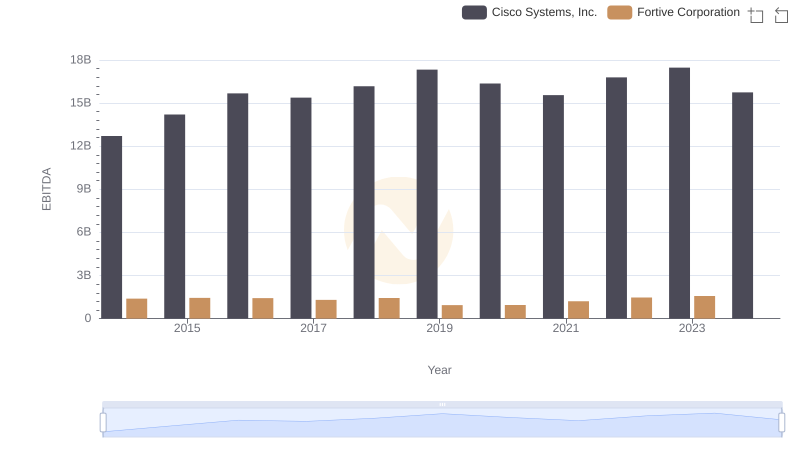
Comprehensive EBITDA Comparison: Cisco Systems, Inc. vs Fortive Corporation
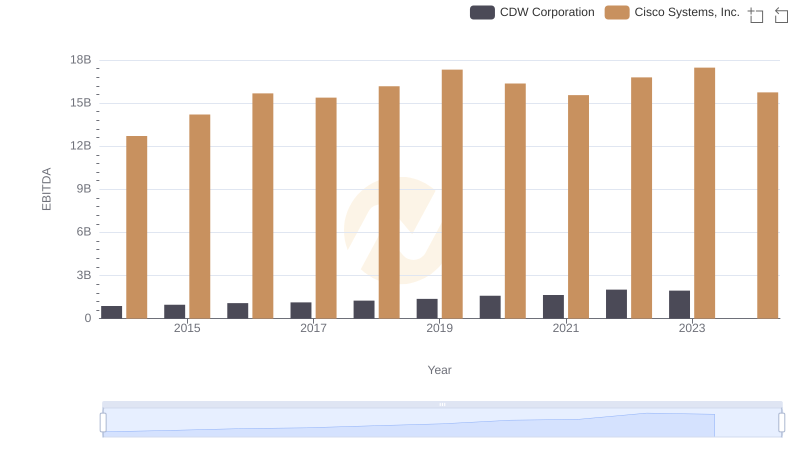
A Side-by-Side Analysis of EBITDA: Cisco Systems, Inc. and CDW Corporation
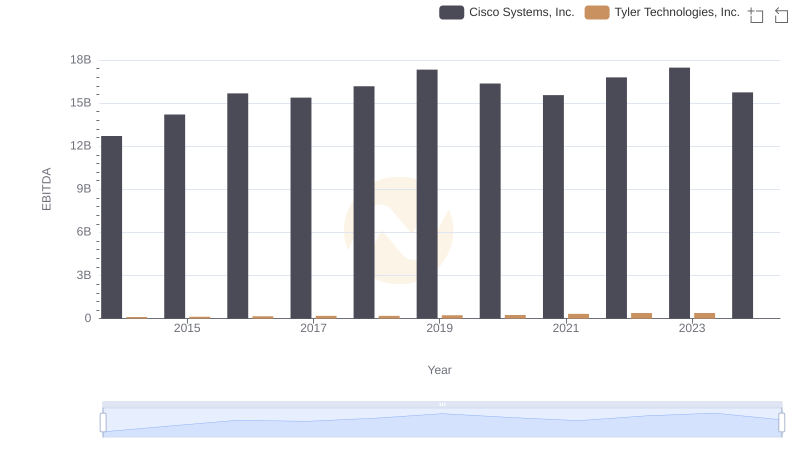
EBITDA Performance Review: Cisco Systems, Inc. vs Tyler Technologies, Inc.