| __timestamp | Cintas Corporation | Verisk Analytics, Inc. |
|---|---|---|
| Wednesday, January 1, 2014 | 793811000 | 776000000 |
| Thursday, January 1, 2015 | 877761000 | 972500000 |
| Friday, January 1, 2016 | 933728000 | 985300000 |
| Sunday, January 1, 2017 | 968293000 | 1047800000 |
| Monday, January 1, 2018 | 1227852000 | 1145500000 |
| Tuesday, January 1, 2019 | 1564228000 | 1018900000 |
| Wednesday, January 1, 2020 | 1542737000 | 1393800000 |
| Friday, January 1, 2021 | 1773591000 | 1163700000 |
| Saturday, January 1, 2022 | 1990046000 | 1639800000 |
| Sunday, January 1, 2023 | 2221676000 | 1424100000 |
| Monday, January 1, 2024 | 2523857000 |
Unleashing insights
In the ever-evolving landscape of corporate finance, EBITDA serves as a crucial metric for evaluating a company's operational performance. This analysis delves into the EBITDA trends of Cintas Corporation and Verisk Analytics, Inc. from 2014 to 2023. Over this period, Cintas has demonstrated a robust growth trajectory, with its EBITDA increasing by approximately 218%, from $794 million in 2014 to an impressive $2.22 billion in 2023. In contrast, Verisk Analytics experienced a more modest growth of around 84%, reaching $1.42 billion in 2023. Notably, Cintas consistently outperformed Verisk, particularly from 2018 onwards, where its EBITDA surged past the $1.5 billion mark. The data for 2024 is incomplete, highlighting the dynamic nature of financial forecasting. This analysis underscores the importance of strategic management and market positioning in driving financial success.
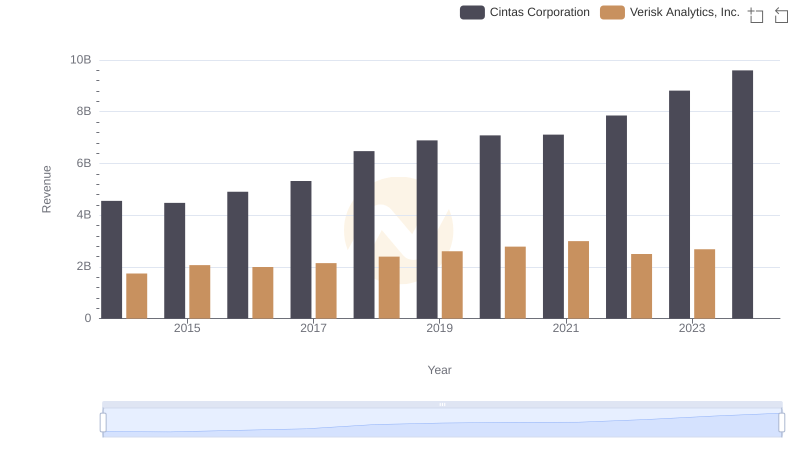
Comparing Revenue Performance: Cintas Corporation or Verisk Analytics, Inc.?
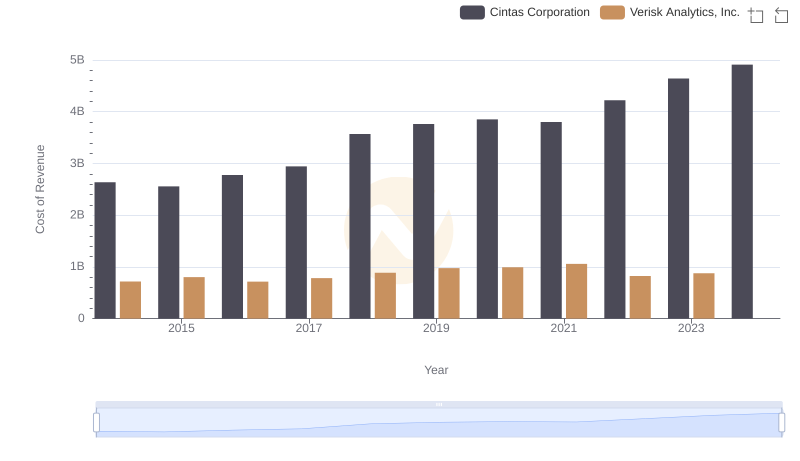
Cost Insights: Breaking Down Cintas Corporation and Verisk Analytics, Inc.'s Expenses
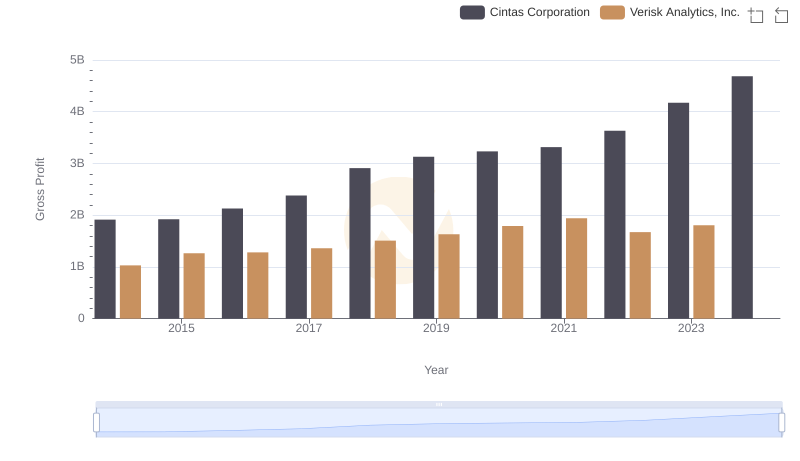
Cintas Corporation and Verisk Analytics, Inc.: A Detailed Gross Profit Analysis
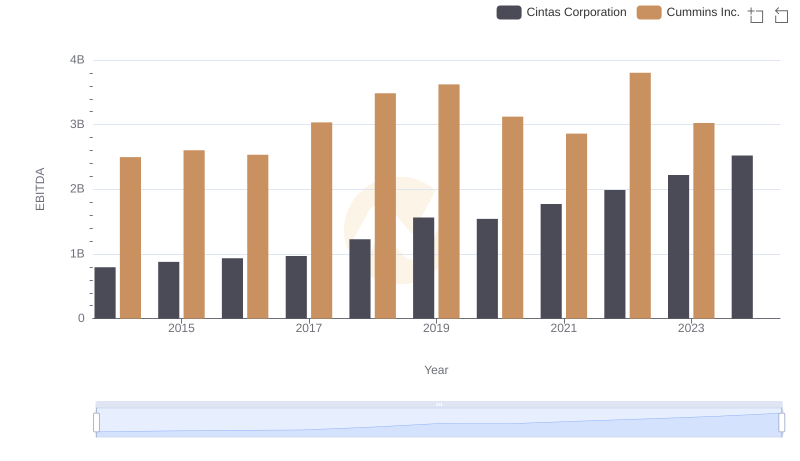
EBITDA Analysis: Evaluating Cintas Corporation Against Cummins Inc.
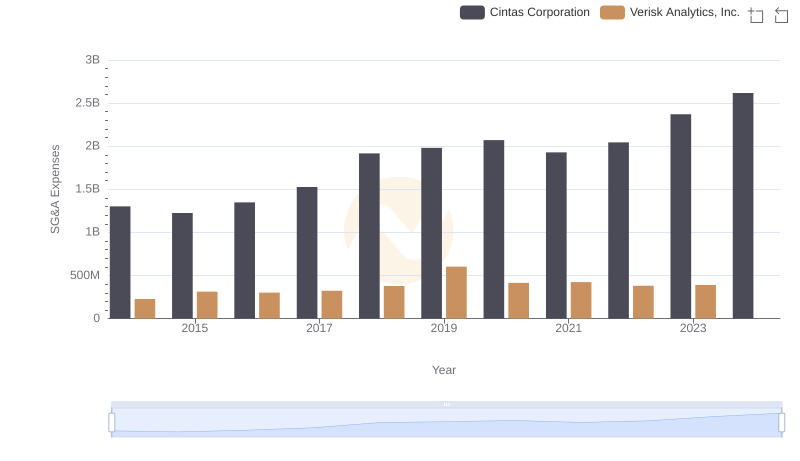
Cintas Corporation vs Verisk Analytics, Inc.: SG&A Expense Trends
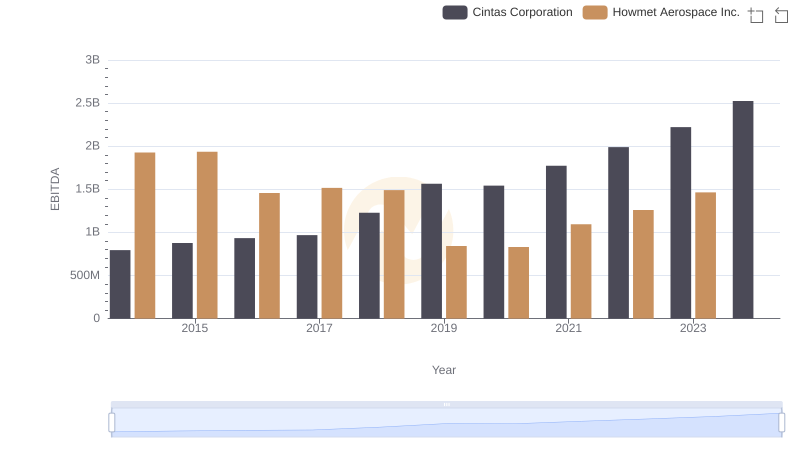
Professional EBITDA Benchmarking: Cintas Corporation vs Howmet Aerospace Inc.
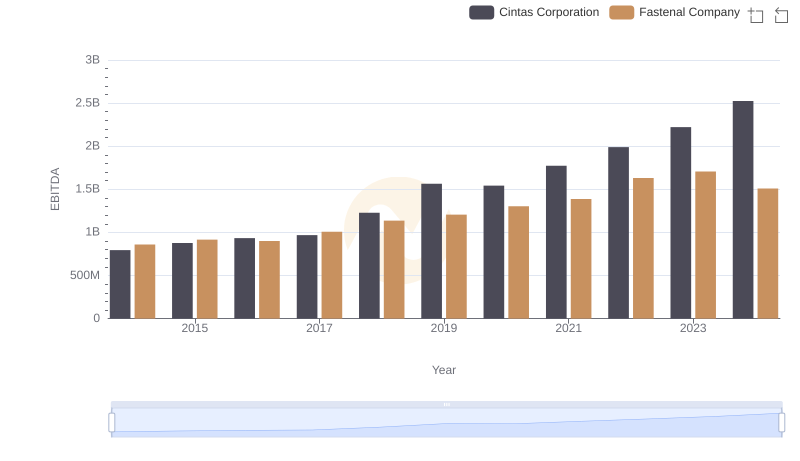
EBITDA Analysis: Evaluating Cintas Corporation Against Fastenal Company
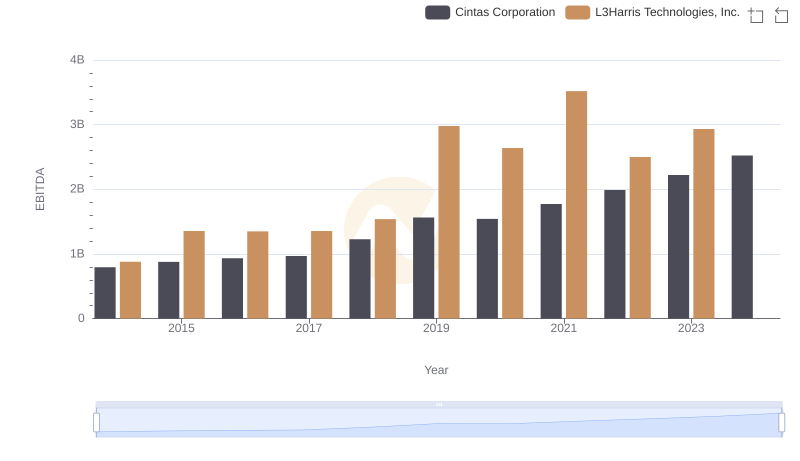
Comprehensive EBITDA Comparison: Cintas Corporation vs L3Harris Technologies, Inc.
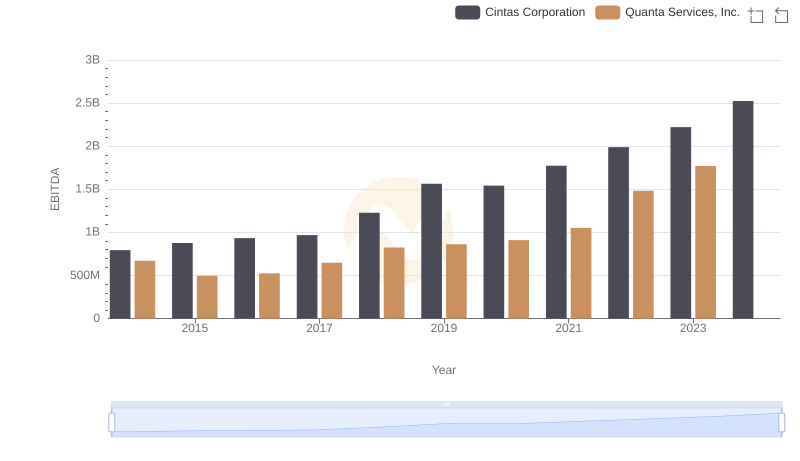
Comparative EBITDA Analysis: Cintas Corporation vs Quanta Services, Inc.
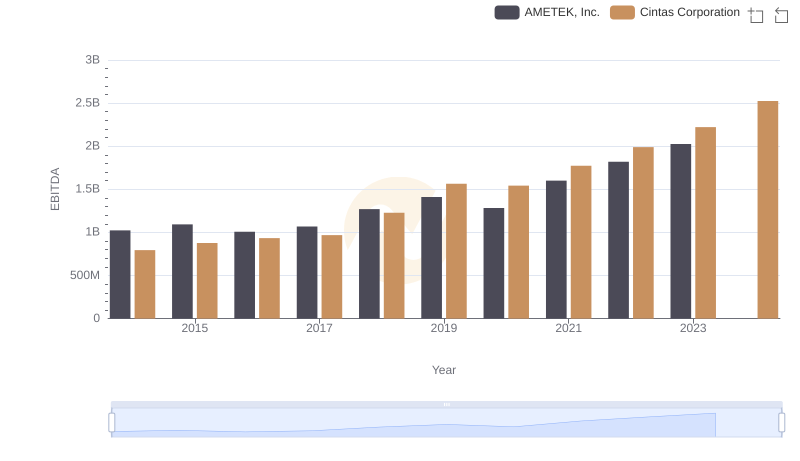
Cintas Corporation vs AMETEK, Inc.: In-Depth EBITDA Performance Comparison
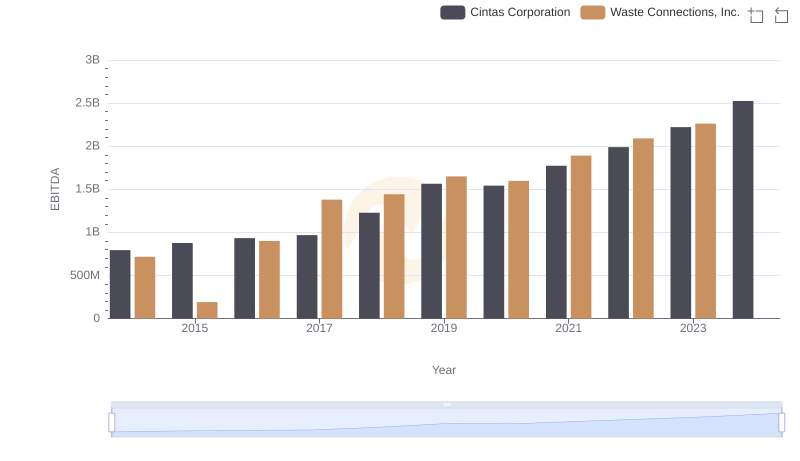
A Side-by-Side Analysis of EBITDA: Cintas Corporation and Waste Connections, Inc.
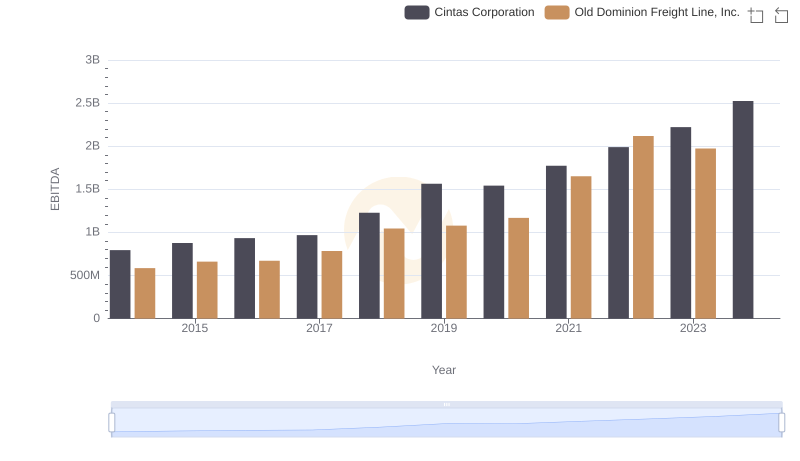
Professional EBITDA Benchmarking: Cintas Corporation vs Old Dominion Freight Line, Inc.