| __timestamp | Cintas Corporation | Verisk Analytics, Inc. |
|---|---|---|
| Wednesday, January 1, 2014 | 2637426000 | 716598000 |
| Thursday, January 1, 2015 | 2555549000 | 803274000 |
| Friday, January 1, 2016 | 2775588000 | 714400000 |
| Sunday, January 1, 2017 | 2943086000 | 783800000 |
| Monday, January 1, 2018 | 3568109000 | 886200000 |
| Tuesday, January 1, 2019 | 3763715000 | 976800000 |
| Wednesday, January 1, 2020 | 3851372000 | 993900000 |
| Friday, January 1, 2021 | 3801689000 | 1057800000 |
| Saturday, January 1, 2022 | 4222213000 | 824600000 |
| Sunday, January 1, 2023 | 4642401000 | 876500000 |
| Monday, January 1, 2024 | 4910199000 |
Infusing magic into the data realm
In the ever-evolving landscape of corporate finance, understanding cost structures is pivotal. This analysis delves into the cost of revenue trends for Cintas Corporation and Verisk Analytics, Inc. from 2014 to 2023. Over this decade, Cintas Corporation has seen a robust increase in its cost of revenue, growing by approximately 86%, from $2.64 billion in 2014 to $4.91 billion in 2023. This reflects the company's expanding operations and market reach. In contrast, Verisk Analytics, Inc. experienced a more modest growth of around 22% in its cost of revenue, peaking at $1.06 billion in 2021 before slightly declining. The data for 2024 is incomplete, highlighting the dynamic nature of financial forecasting. This comparative insight underscores the differing growth trajectories and operational strategies of these two industry giants.
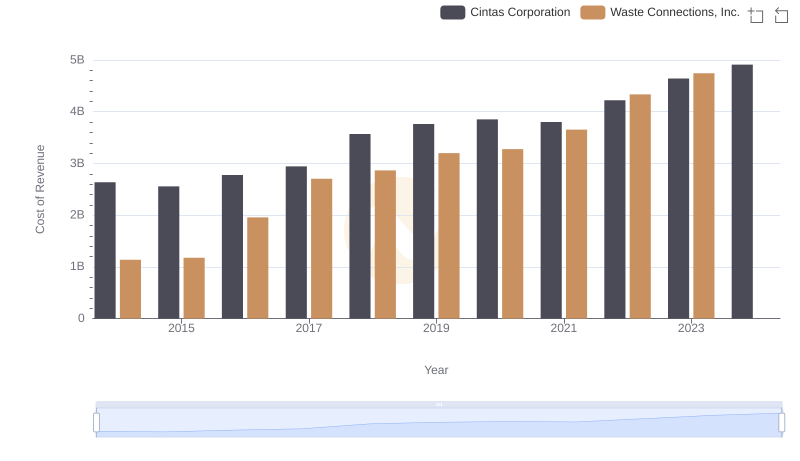
Cost of Revenue Comparison: Cintas Corporation vs Waste Connections, Inc.
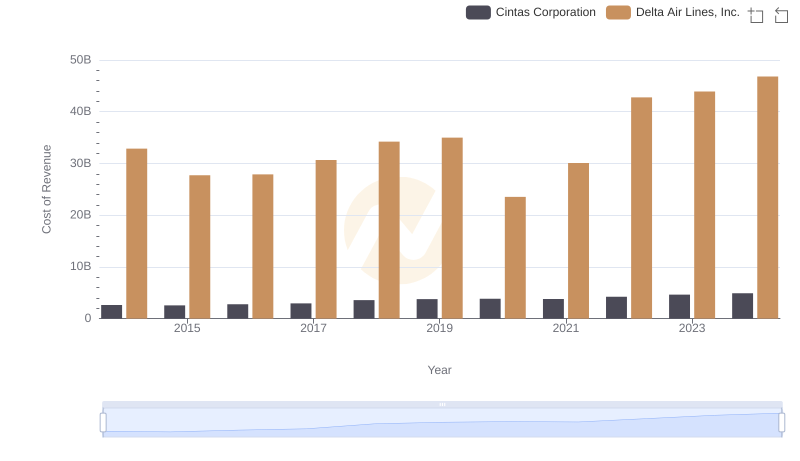
Cost Insights: Breaking Down Cintas Corporation and Delta Air Lines, Inc.'s Expenses
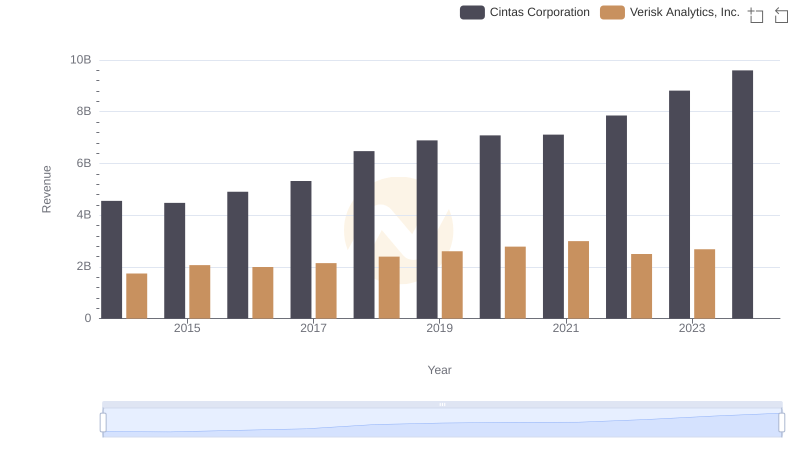
Comparing Revenue Performance: Cintas Corporation or Verisk Analytics, Inc.?
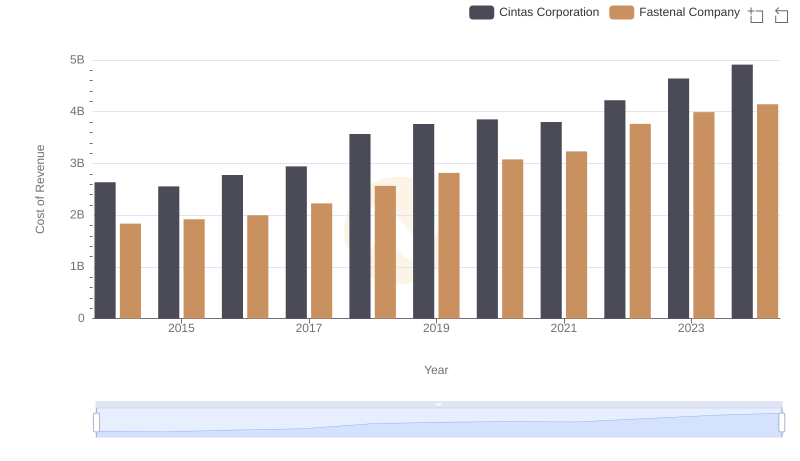
Cost of Revenue Trends: Cintas Corporation vs Fastenal Company
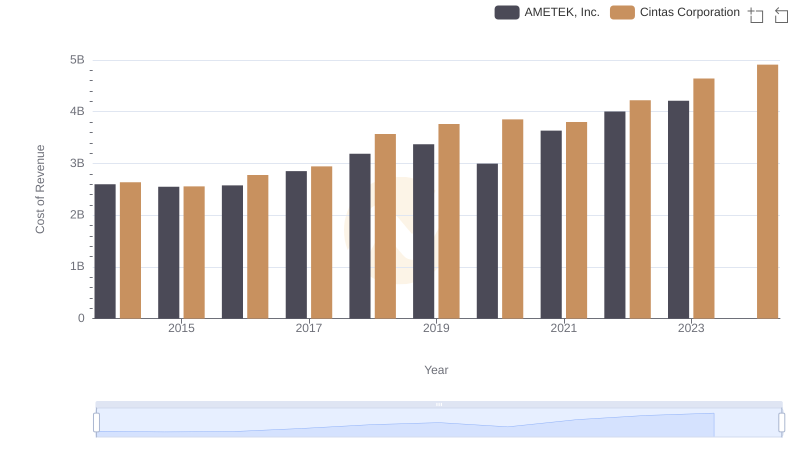
Analyzing Cost of Revenue: Cintas Corporation and AMETEK, Inc.
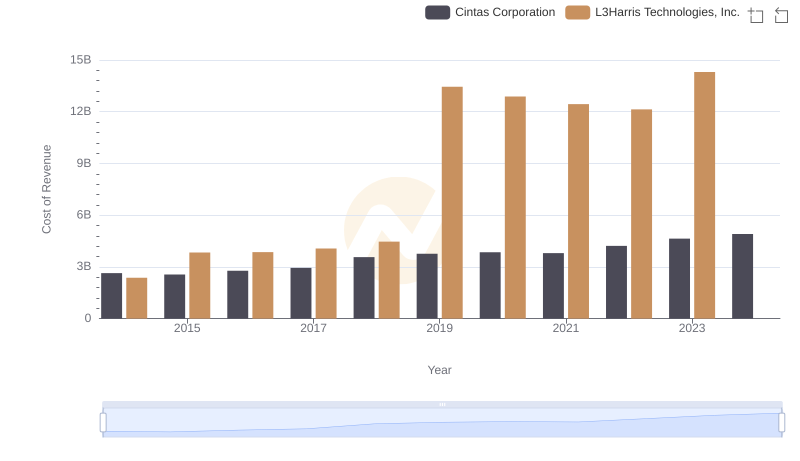
Analyzing Cost of Revenue: Cintas Corporation and L3Harris Technologies, Inc.
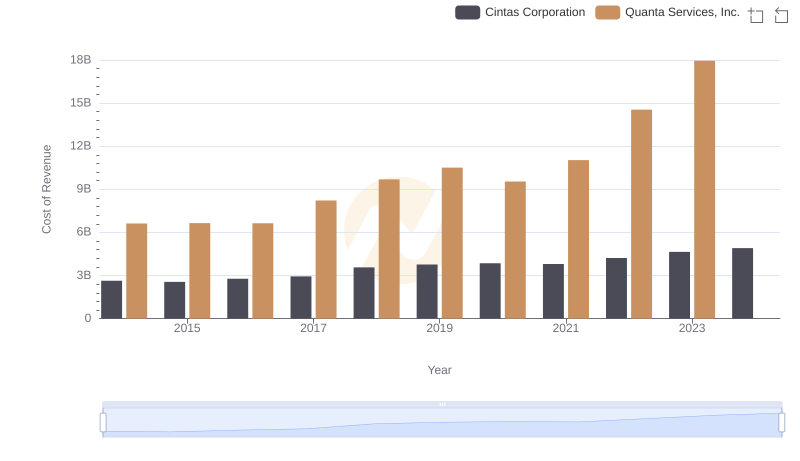
Analyzing Cost of Revenue: Cintas Corporation and Quanta Services, Inc.
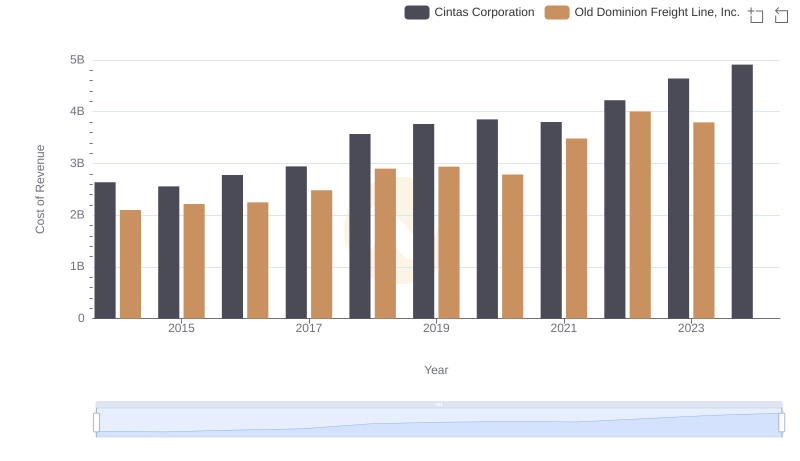
Cost Insights: Breaking Down Cintas Corporation and Old Dominion Freight Line, Inc.'s Expenses
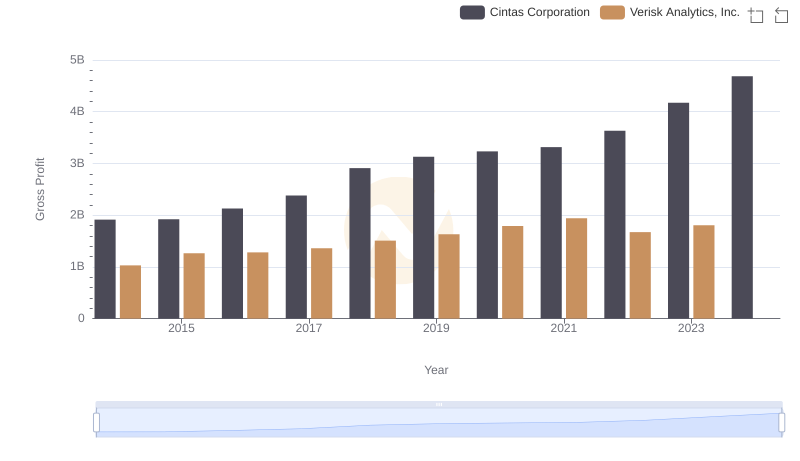
Cintas Corporation and Verisk Analytics, Inc.: A Detailed Gross Profit Analysis
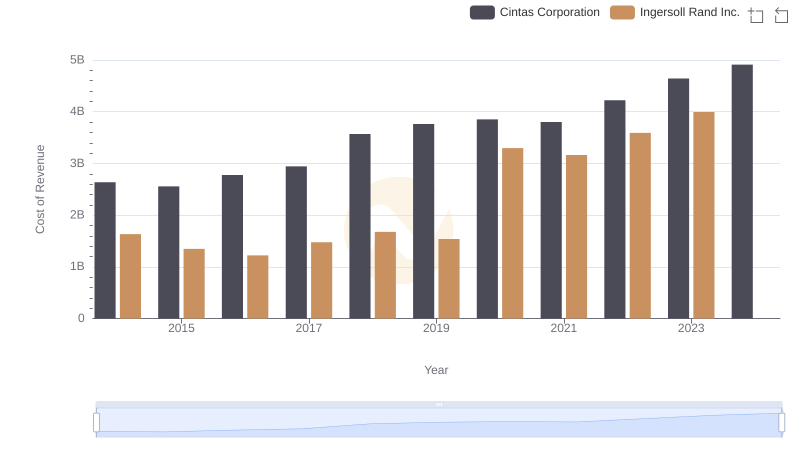
Cost Insights: Breaking Down Cintas Corporation and Ingersoll Rand Inc.'s Expenses
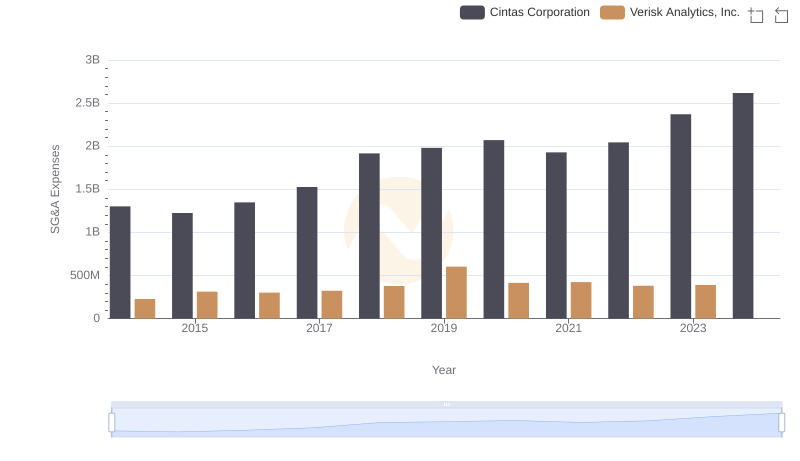
Cintas Corporation vs Verisk Analytics, Inc.: SG&A Expense Trends
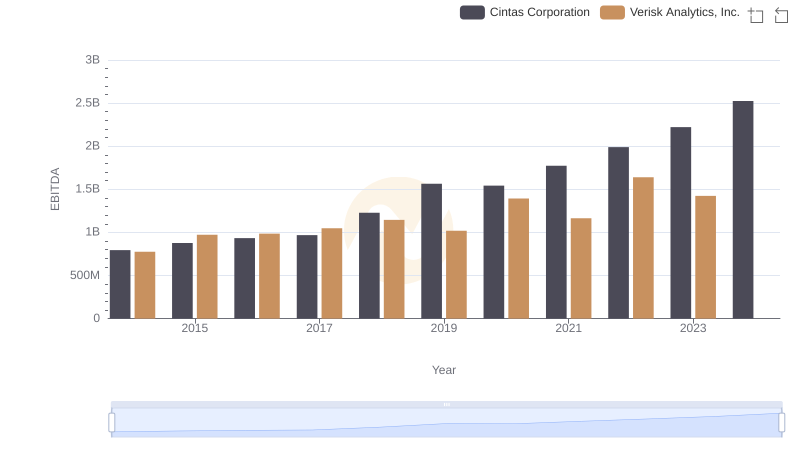
A Side-by-Side Analysis of EBITDA: Cintas Corporation and Verisk Analytics, Inc.