| __timestamp | Cintas Corporation | Global Payments Inc. |
|---|---|---|
| Wednesday, January 1, 2014 | 1302752000 | 1295014000 |
| Thursday, January 1, 2015 | 1224930000 | 1325567000 |
| Friday, January 1, 2016 | 1348122000 | 1411096000 |
| Sunday, January 1, 2017 | 1527380000 | 1488258000 |
| Monday, January 1, 2018 | 1916792000 | 1534297000 |
| Tuesday, January 1, 2019 | 1980644000 | 2046672000 |
| Wednesday, January 1, 2020 | 2071052000 | 2878878000 |
| Friday, January 1, 2021 | 1929159000 | 3391161000 |
| Saturday, January 1, 2022 | 2044876000 | 3524578000 |
| Sunday, January 1, 2023 | 2370704000 | 4073768000 |
| Monday, January 1, 2024 | 2617783000 | 4285307000 |
Data in motion
In the ever-evolving landscape of corporate finance, understanding the spending patterns of industry giants can offer invaluable insights. Cintas Corporation and Global Payments Inc., two stalwarts in their respective fields, have shown distinct trajectories in their Selling, General, and Administrative (SG&A) expenses over the past decade.
From 2014 to 2023, Cintas Corporation's SG&A expenses grew by approximately 101%, reflecting a strategic expansion and operational scaling. In contrast, Global Payments Inc. exhibited a staggering 215% increase in the same period, underscoring its aggressive growth and acquisition strategy. Notably, in 2023, Global Payments Inc.'s SG&A expenses were about 72% higher than those of Cintas Corporation.
While Cintas continued its upward trend into 2024, data for Global Payments Inc. remains elusive, leaving analysts speculating about its future financial maneuvers. This comparison not only highlights the diverse strategies of these corporations but also serves as a beacon for investors seeking to understand market dynamics.
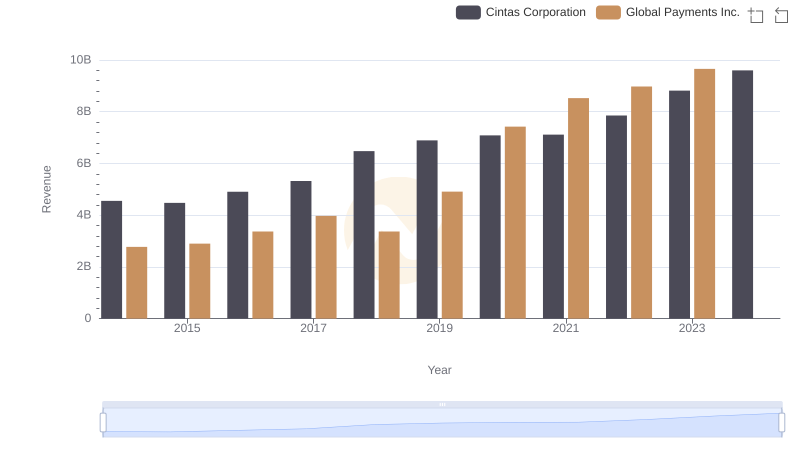
Comparing Revenue Performance: Cintas Corporation or Global Payments Inc.?
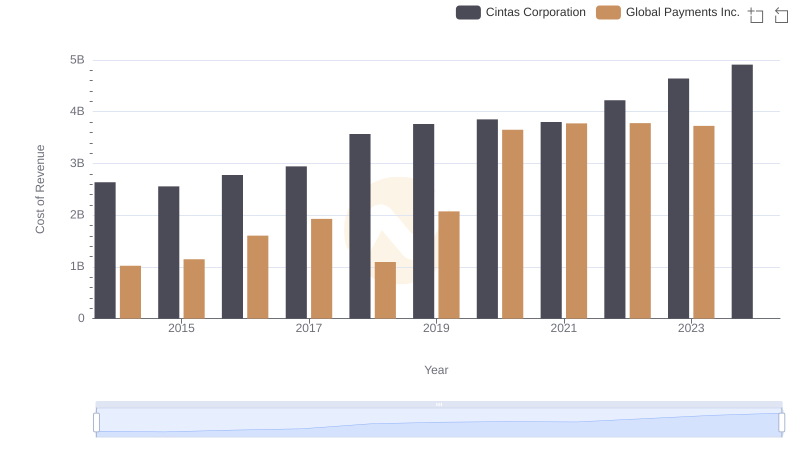
Comparing Cost of Revenue Efficiency: Cintas Corporation vs Global Payments Inc.
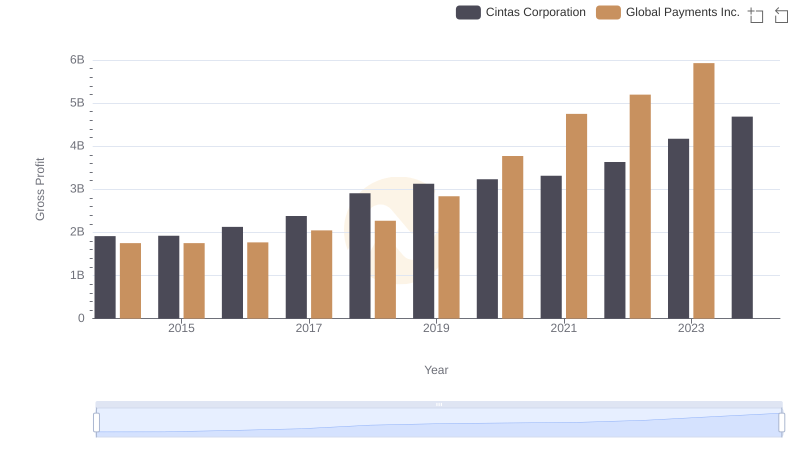
Who Generates Higher Gross Profit? Cintas Corporation or Global Payments Inc.
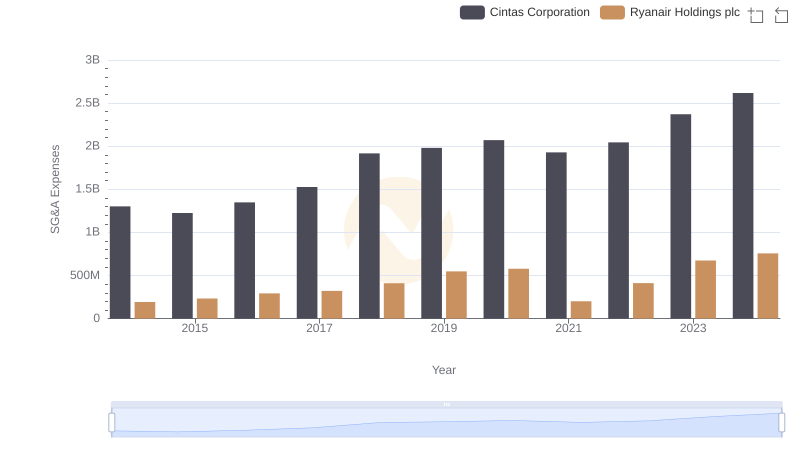
Comparing SG&A Expenses: Cintas Corporation vs Ryanair Holdings plc Trends and Insights
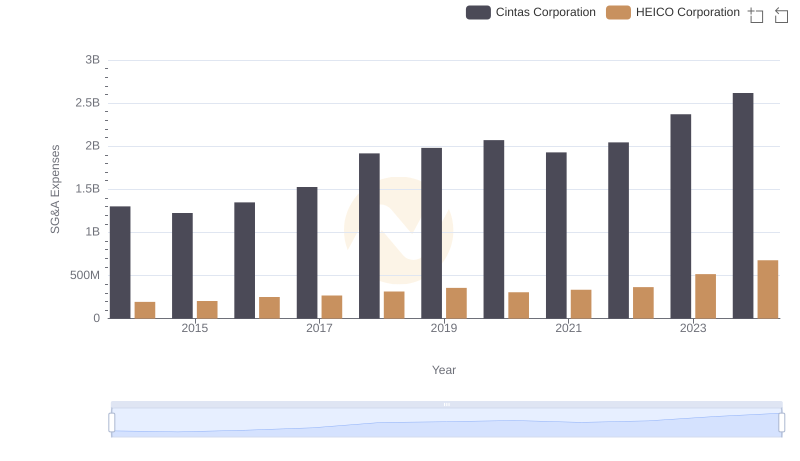
Cintas Corporation vs HEICO Corporation: SG&A Expense Trends
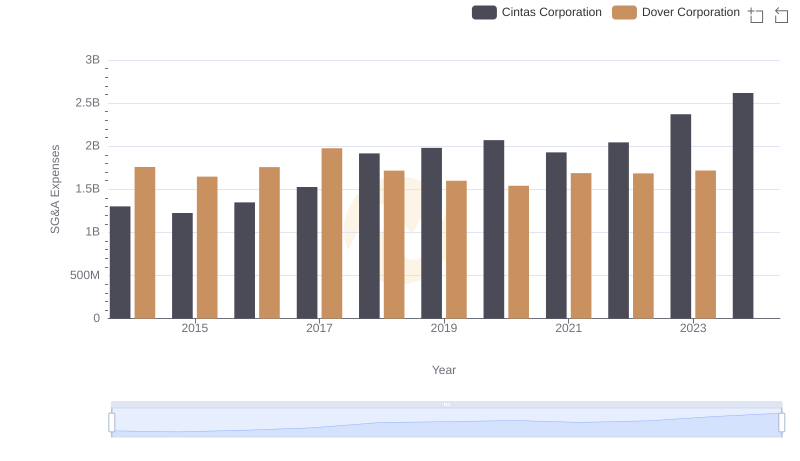
Cintas Corporation and Dover Corporation: SG&A Spending Patterns Compared
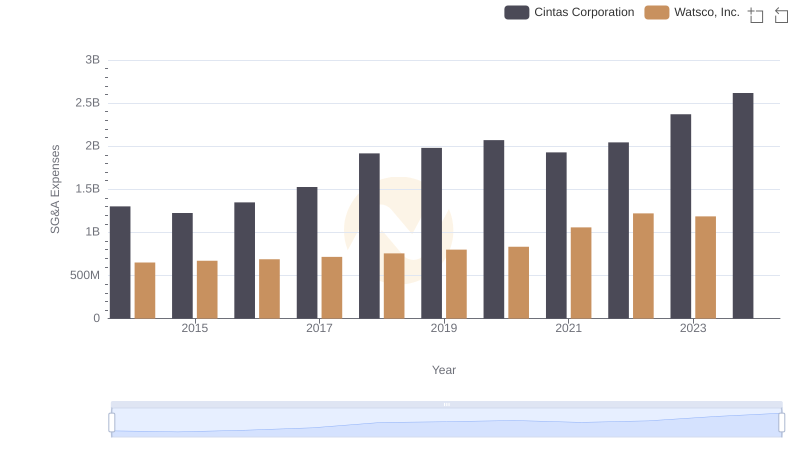
Cintas Corporation vs Watsco, Inc.: SG&A Expense Trends
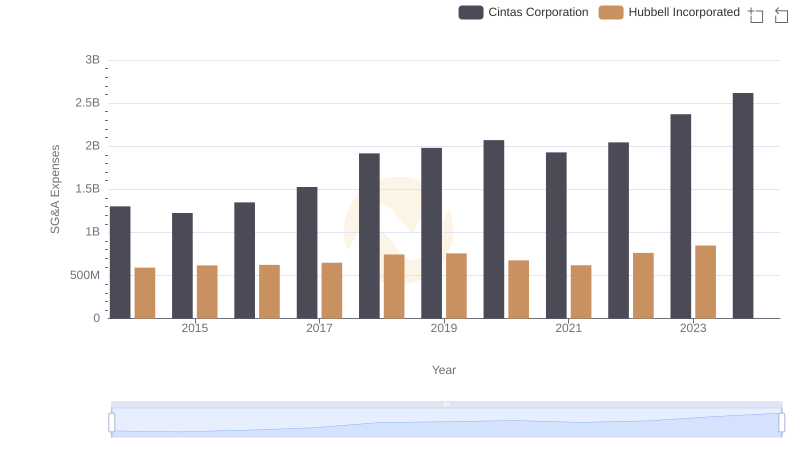
SG&A Efficiency Analysis: Comparing Cintas Corporation and Hubbell Incorporated
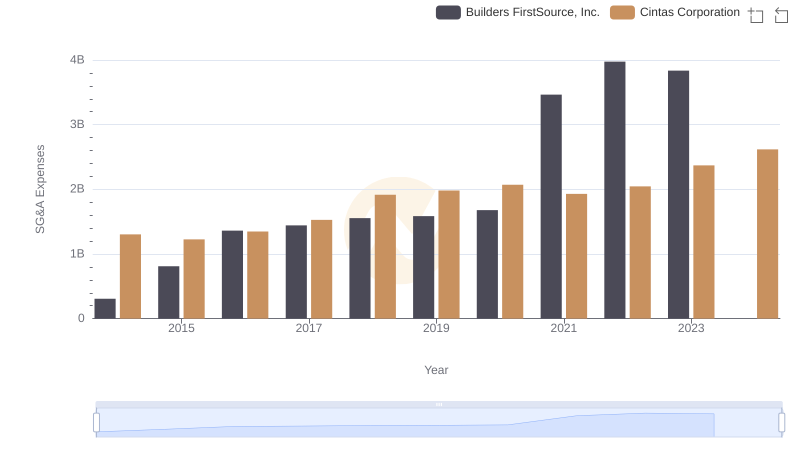
Breaking Down SG&A Expenses: Cintas Corporation vs Builders FirstSource, Inc.
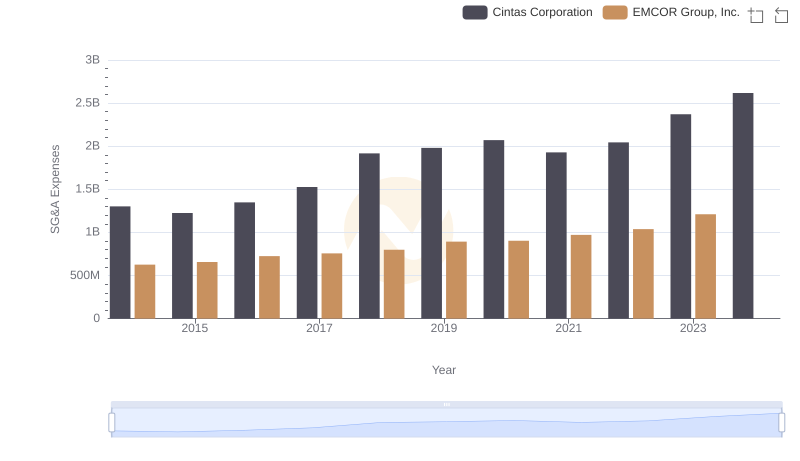
Comparing SG&A Expenses: Cintas Corporation vs EMCOR Group, Inc. Trends and Insights