| __timestamp | IDEX Corporation | United Rentals, Inc. |
|---|---|---|
| Wednesday, January 1, 2014 | 504419000 | 758000000 |
| Thursday, January 1, 2015 | 479408000 | 714000000 |
| Friday, January 1, 2016 | 498994000 | 719000000 |
| Sunday, January 1, 2017 | 524940000 | 903000000 |
| Monday, January 1, 2018 | 536724000 | 1038000000 |
| Tuesday, January 1, 2019 | 524987000 | 1092000000 |
| Wednesday, January 1, 2020 | 494935000 | 979000000 |
| Friday, January 1, 2021 | 578200000 | 1199000000 |
| Saturday, January 1, 2022 | 652700000 | 1400000000 |
| Sunday, January 1, 2023 | 703500000 | 1527000000 |
| Monday, January 1, 2024 | 758700000 | 1645000000 |
In pursuit of knowledge
In the ever-evolving landscape of corporate finance, understanding the nuances of Selling, General, and Administrative (SG&A) expenses is crucial. Over the past decade, United Rentals, Inc. and IDEX Corporation have showcased distinct spending patterns. From 2014 to 2023, United Rentals consistently outpaced IDEX in SG&A expenses, with a notable 113% increase, peaking at approximately $1.53 billion in 2023. In contrast, IDEX Corporation's SG&A expenses grew by about 40%, reaching around $703 million in the same year. This divergence highlights United Rentals' aggressive expansion strategy, while IDEX maintains a more conservative approach. Interestingly, data for 2024 is incomplete, leaving room for speculation on future trends. As businesses navigate post-pandemic recovery, these spending patterns offer valuable insights into strategic priorities and market positioning.
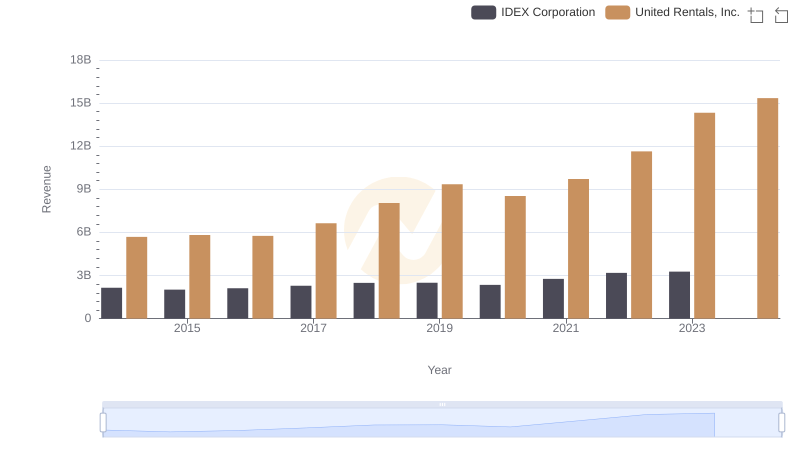
United Rentals, Inc. and IDEX Corporation: A Comprehensive Revenue Analysis
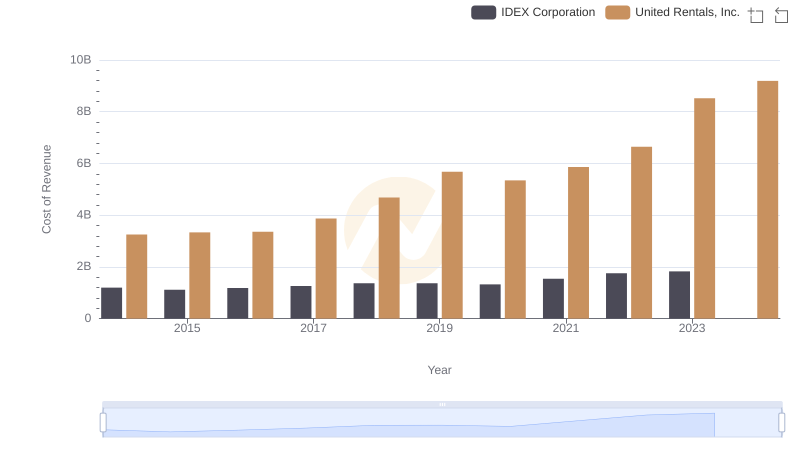
Analyzing Cost of Revenue: United Rentals, Inc. and IDEX Corporation
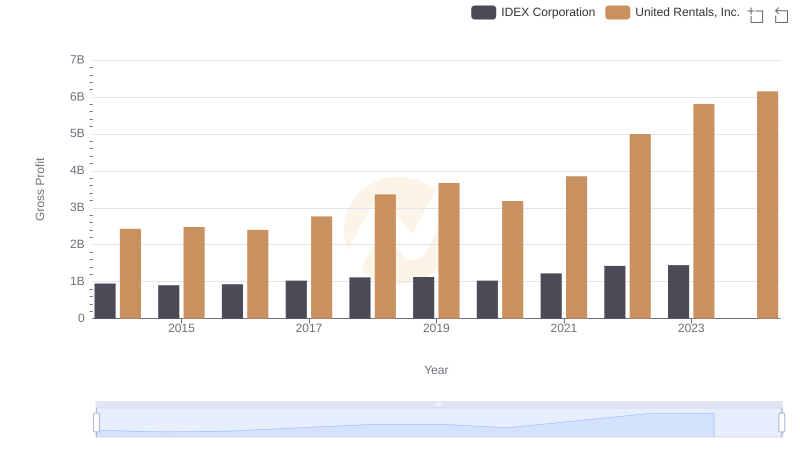
Gross Profit Analysis: Comparing United Rentals, Inc. and IDEX Corporation
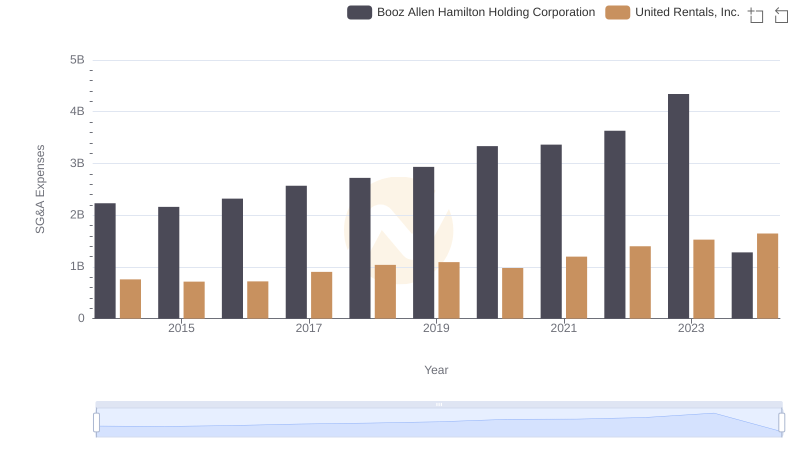
United Rentals, Inc. and Booz Allen Hamilton Holding Corporation: SG&A Spending Patterns Compared
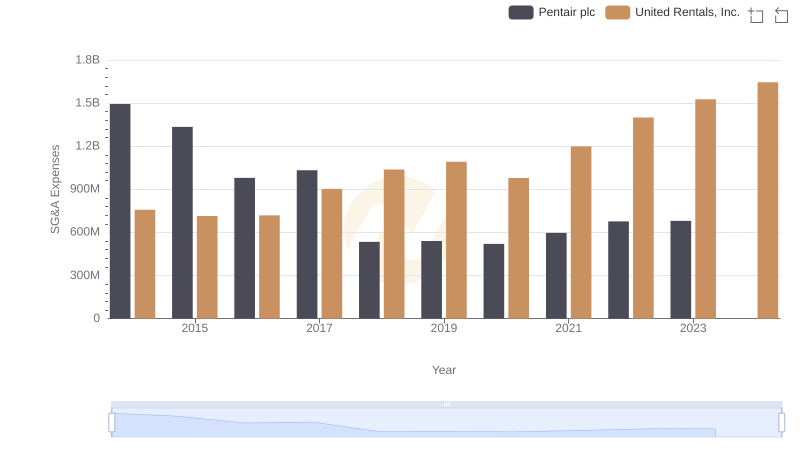
United Rentals, Inc. vs Pentair plc: SG&A Expense Trends
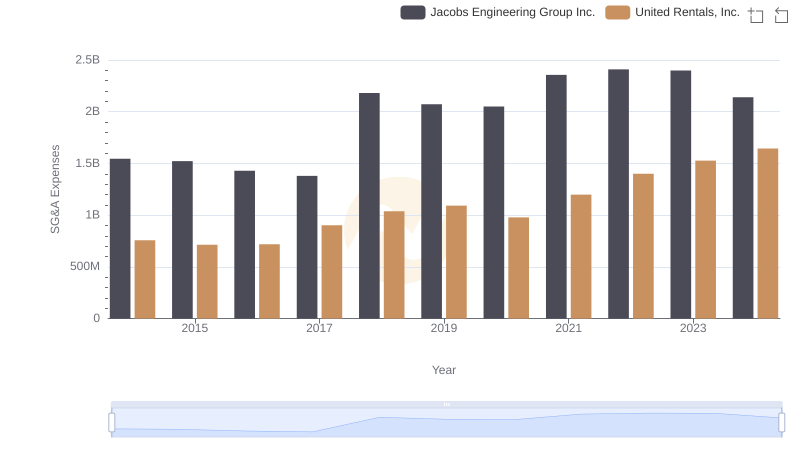
Who Optimizes SG&A Costs Better? United Rentals, Inc. or Jacobs Engineering Group Inc.
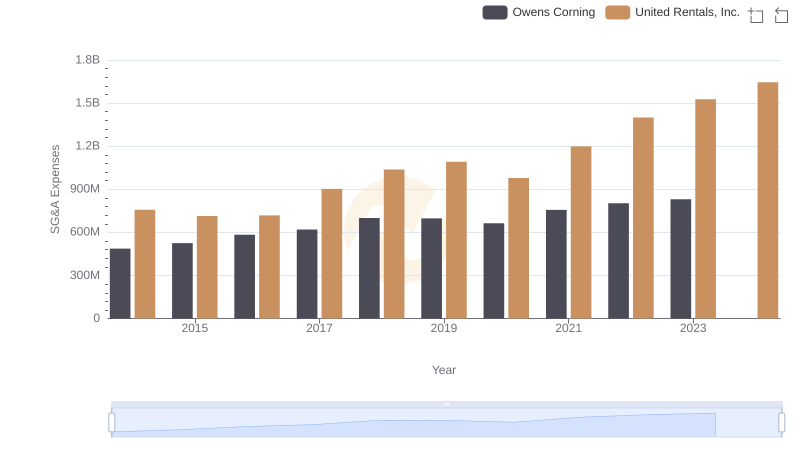
Breaking Down SG&A Expenses: United Rentals, Inc. vs Owens Corning
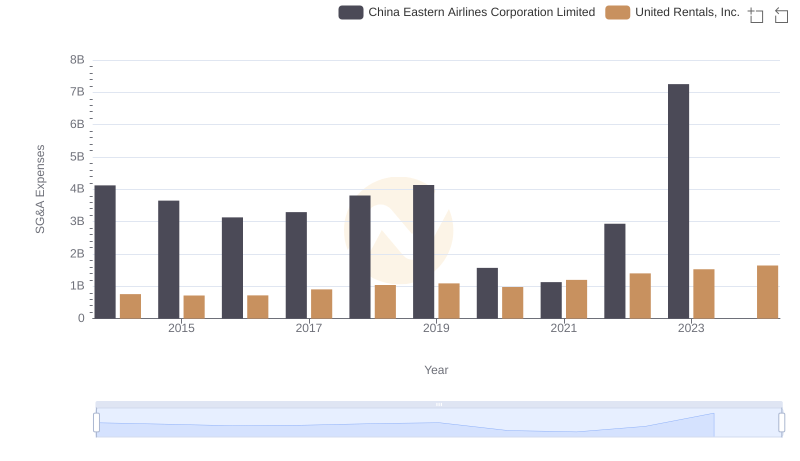
United Rentals, Inc. or China Eastern Airlines Corporation Limited: Who Manages SG&A Costs Better?
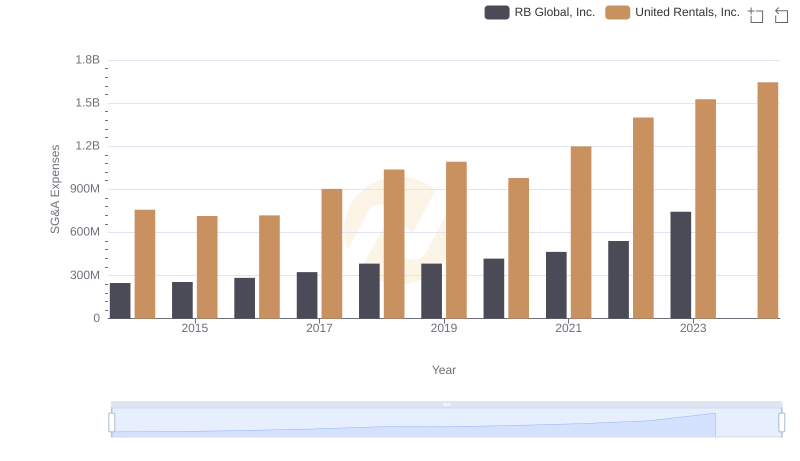
United Rentals, Inc. and RB Global, Inc.: SG&A Spending Patterns Compared

Breaking Down SG&A Expenses: United Rentals, Inc. vs Expeditors International of Washington, Inc.
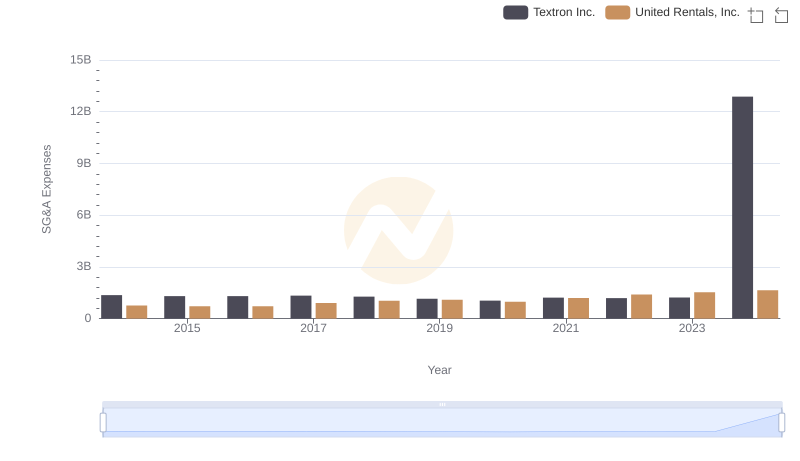
Comparing SG&A Expenses: United Rentals, Inc. vs Textron Inc. Trends and Insights

Comparative EBITDA Analysis: United Rentals, Inc. vs IDEX Corporation