| __timestamp | Saia, Inc. | United Rentals, Inc. |
|---|---|---|
| Wednesday, January 1, 2014 | 1272321000 | 5685000000 |
| Thursday, January 1, 2015 | 1221311000 | 5817000000 |
| Friday, January 1, 2016 | 1218481000 | 5762000000 |
| Sunday, January 1, 2017 | 1378510000 | 6641000000 |
| Monday, January 1, 2018 | 1653849000 | 8047000000 |
| Tuesday, January 1, 2019 | 1786735000 | 9351000000 |
| Wednesday, January 1, 2020 | 1822366000 | 8530000000 |
| Friday, January 1, 2021 | 2288704000 | 9716000000 |
| Saturday, January 1, 2022 | 2792057000 | 11642000000 |
| Sunday, January 1, 2023 | 2881433000 | 14332000000 |
| Monday, January 1, 2024 | 15345000000 |
In pursuit of knowledge
In the competitive landscape of the U.S. stock market, United Rentals, Inc. and Saia, Inc. have showcased intriguing revenue trends over the past decade. From 2014 to 2023, United Rentals, Inc. has consistently outperformed Saia, Inc., with a remarkable revenue growth of over 150%, reaching approximately $14.3 billion in 2023. In contrast, Saia, Inc. has seen a steady increase of around 126%, culminating in nearly $2.9 billion in the same year.
United Rentals, Inc.'s revenue trajectory highlights its dominant position in the equipment rental industry, while Saia, Inc.'s growth reflects its resilience in the transportation sector. Notably, 2024 data for Saia, Inc. is missing, leaving room for speculation on its future performance. This comparison not only underscores the dynamic nature of these industries but also offers valuable insights for investors seeking growth opportunities.

Breaking Down Revenue Trends: United Rentals, Inc. vs Stanley Black & Decker, Inc.
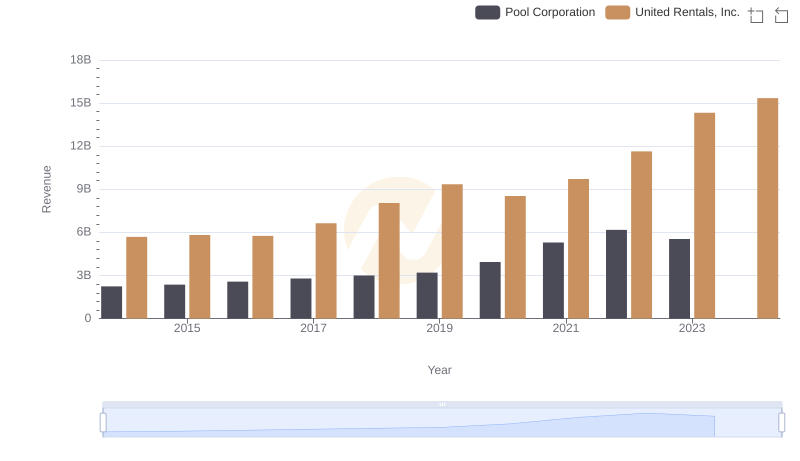
Annual Revenue Comparison: United Rentals, Inc. vs Pool Corporation
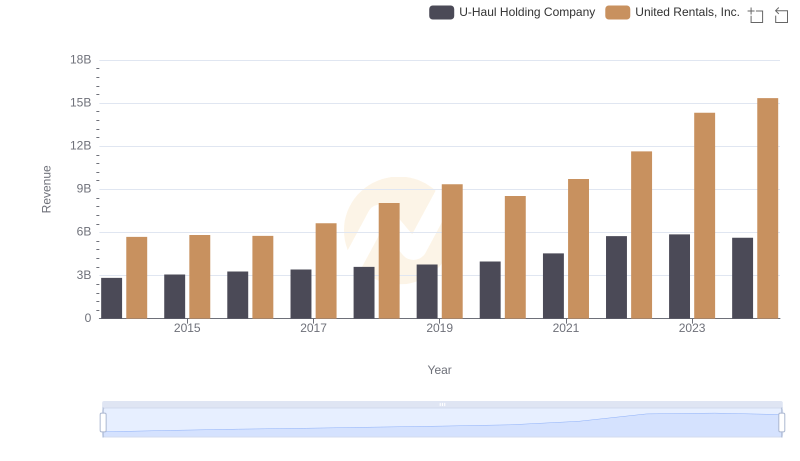
Revenue Showdown: United Rentals, Inc. vs U-Haul Holding Company
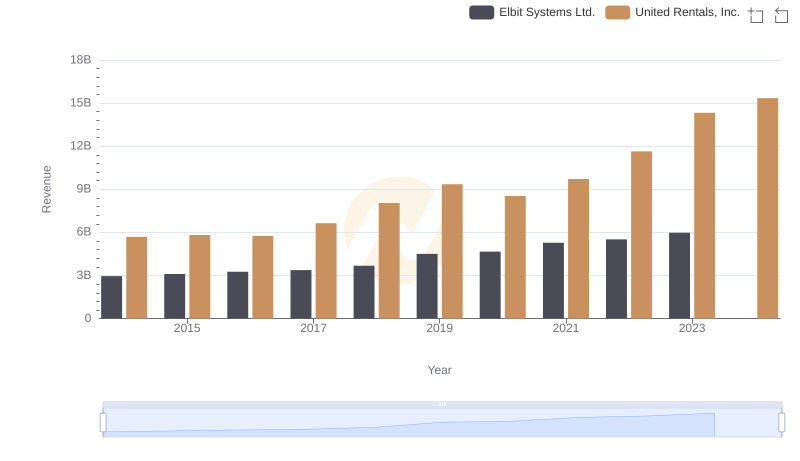
Breaking Down Revenue Trends: United Rentals, Inc. vs Elbit Systems Ltd.
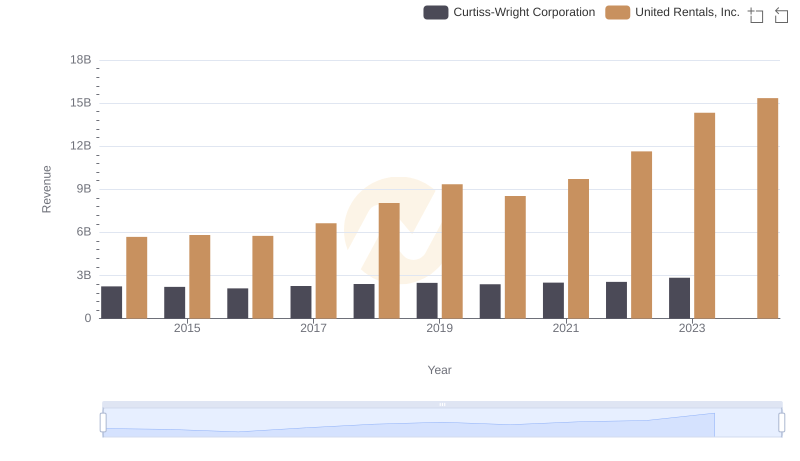
Who Generates More Revenue? United Rentals, Inc. or Curtiss-Wright Corporation
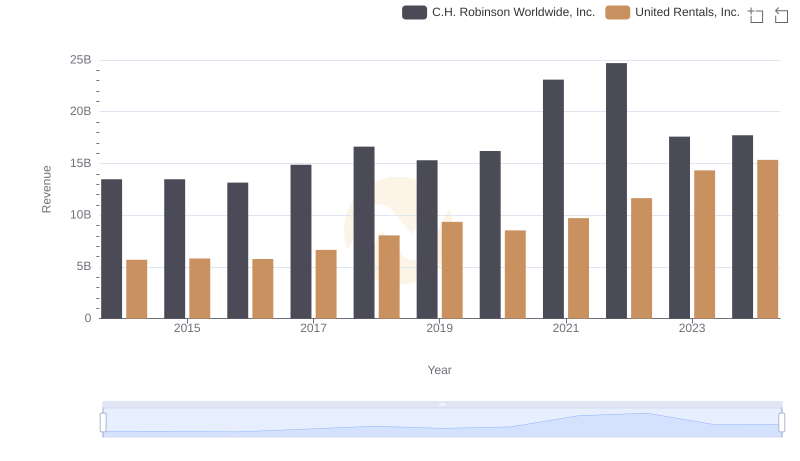
United Rentals, Inc. vs C.H. Robinson Worldwide, Inc.: Examining Key Revenue Metrics
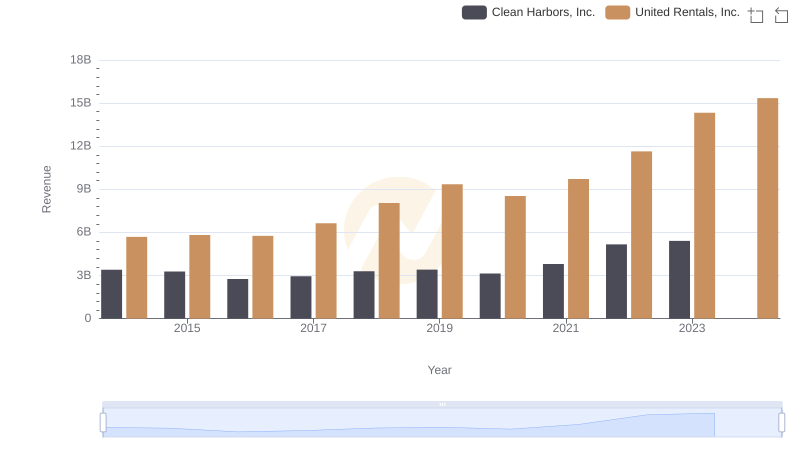
Breaking Down Revenue Trends: United Rentals, Inc. vs Clean Harbors, Inc.
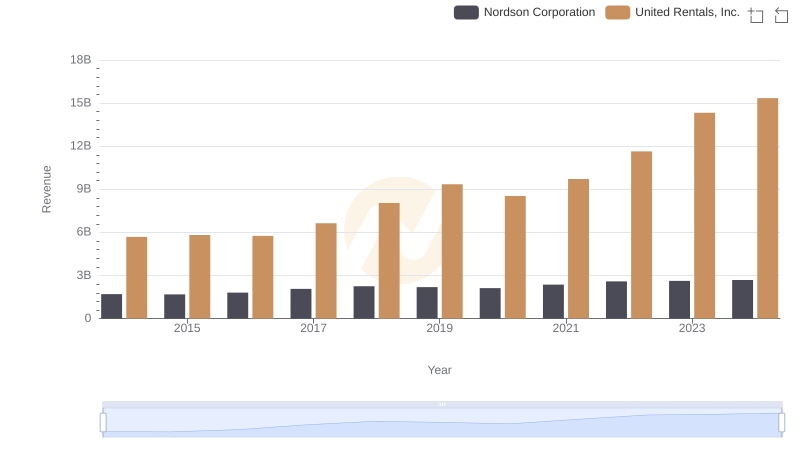
Revenue Showdown: United Rentals, Inc. vs Nordson Corporation
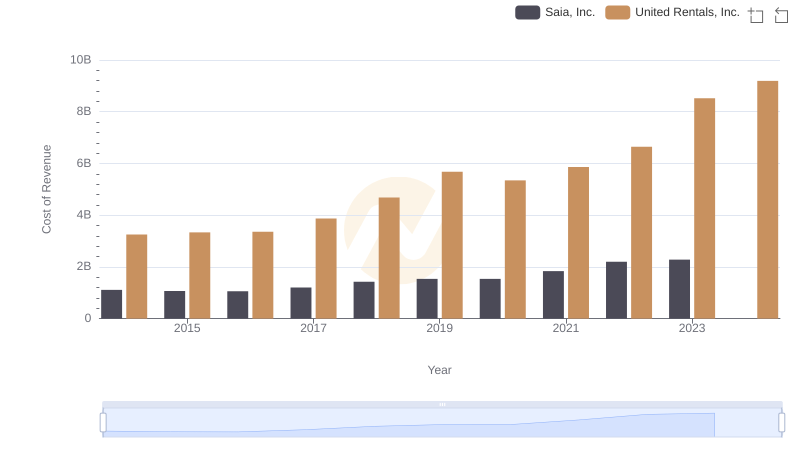
Cost of Revenue Comparison: United Rentals, Inc. vs Saia, Inc.
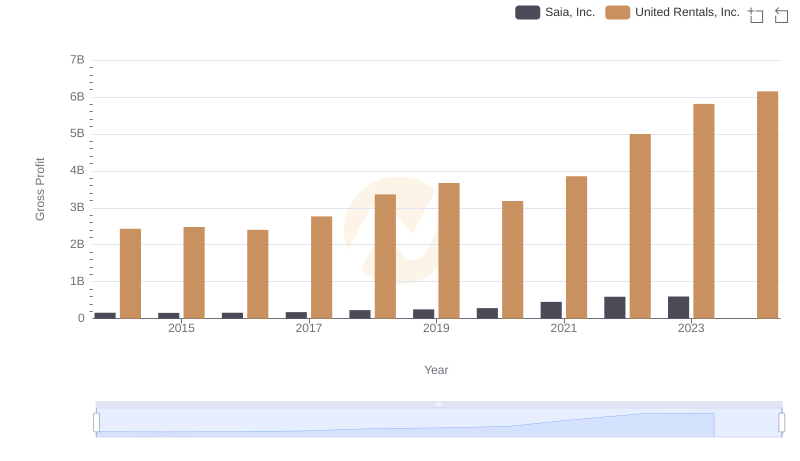
Gross Profit Comparison: United Rentals, Inc. and Saia, Inc. Trends
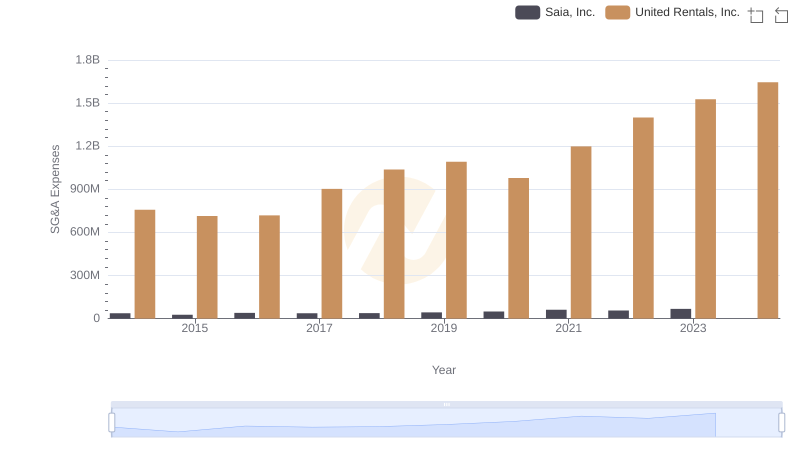
Breaking Down SG&A Expenses: United Rentals, Inc. vs Saia, Inc.
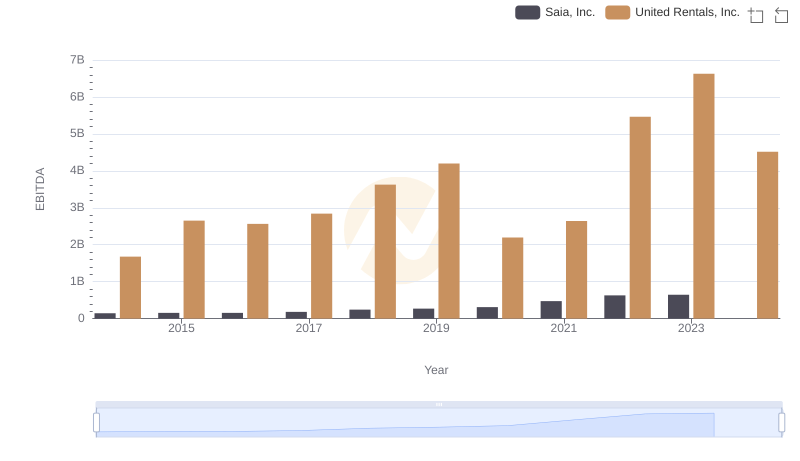
United Rentals, Inc. vs Saia, Inc.: In-Depth EBITDA Performance Comparison