| __timestamp | Pool Corporation | United Rentals, Inc. |
|---|---|---|
| Wednesday, January 1, 2014 | 2246562000 | 5685000000 |
| Thursday, January 1, 2015 | 2363139000 | 5817000000 |
| Friday, January 1, 2016 | 2570803000 | 5762000000 |
| Sunday, January 1, 2017 | 2788188000 | 6641000000 |
| Monday, January 1, 2018 | 2998097000 | 8047000000 |
| Tuesday, January 1, 2019 | 3199517000 | 9351000000 |
| Wednesday, January 1, 2020 | 3936623000 | 8530000000 |
| Friday, January 1, 2021 | 5295584000 | 9716000000 |
| Saturday, January 1, 2022 | 6179727000 | 11642000000 |
| Sunday, January 1, 2023 | 5541595000 | 14332000000 |
| Monday, January 1, 2024 | 15345000000 |
Infusing magic into the data realm
In the ever-evolving landscape of the equipment rental and pool supply industries, United Rentals, Inc. and Pool Corporation have emerged as formidable players. Over the past decade, United Rentals has consistently outpaced Pool Corporation in revenue growth. From 2014 to 2023, United Rentals saw its revenue soar by approximately 152%, reaching a peak of $14.3 billion in 2023. In contrast, Pool Corporation experienced a robust yet more modest growth of around 147%, with revenues peaking at $6.2 billion in 2022.
The data reveals a compelling narrative of resilience and strategic expansion, particularly for United Rentals, which maintained a steady upward trajectory even during challenging economic periods. While Pool Corporation's revenue dipped slightly in 2023, United Rentals continued its ascent, underscoring its dominant position in the market. This comparison not only highlights the dynamic nature of these industries but also offers valuable insights into the strategies driving their success.
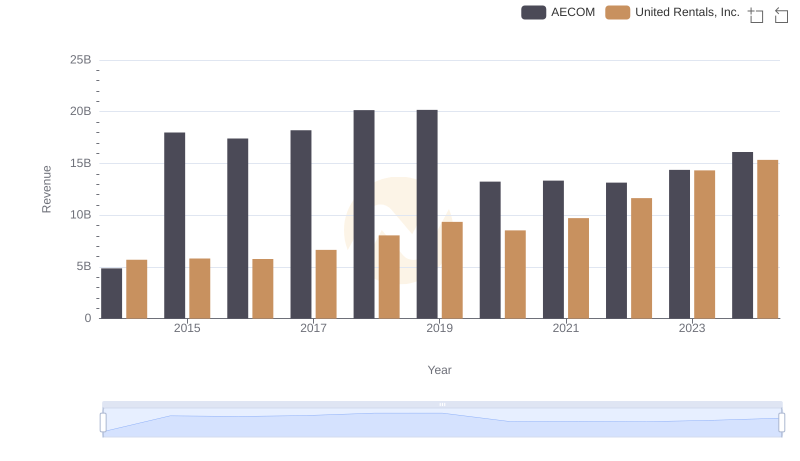
United Rentals, Inc. or AECOM: Who Leads in Yearly Revenue?

Breaking Down Revenue Trends: United Rentals, Inc. vs Stanley Black & Decker, Inc.

Breaking Down Revenue Trends: United Rentals, Inc. vs Saia, Inc.
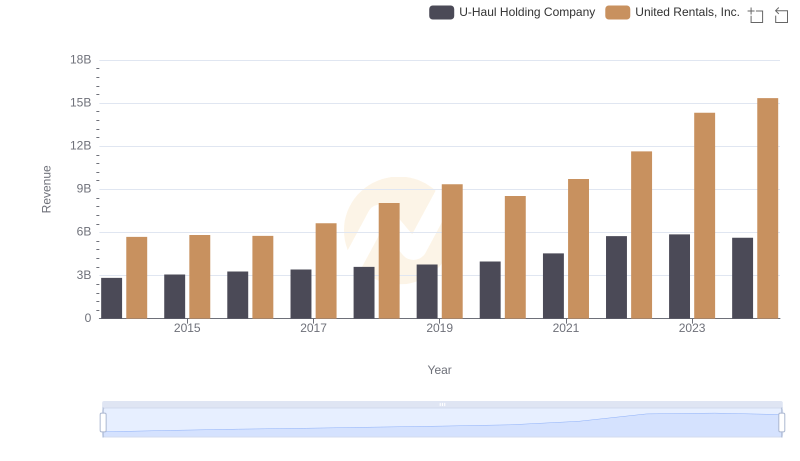
Revenue Showdown: United Rentals, Inc. vs U-Haul Holding Company
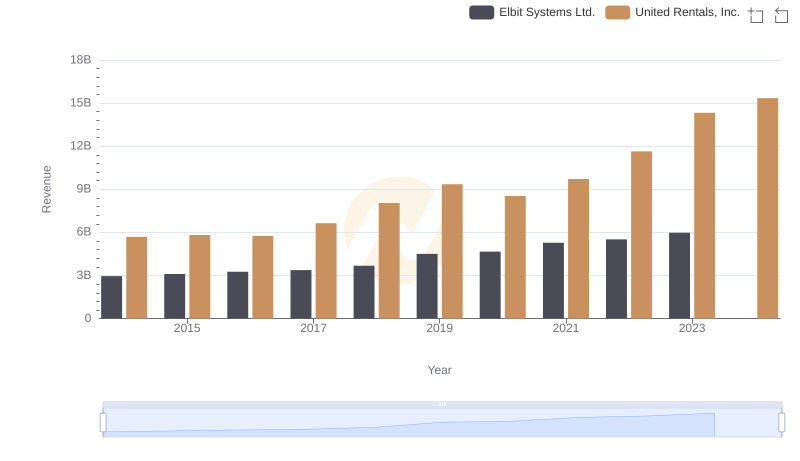
Breaking Down Revenue Trends: United Rentals, Inc. vs Elbit Systems Ltd.
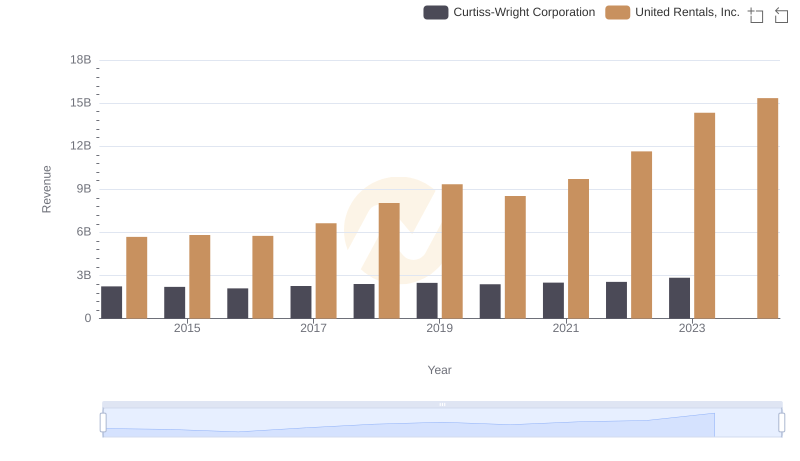
Who Generates More Revenue? United Rentals, Inc. or Curtiss-Wright Corporation
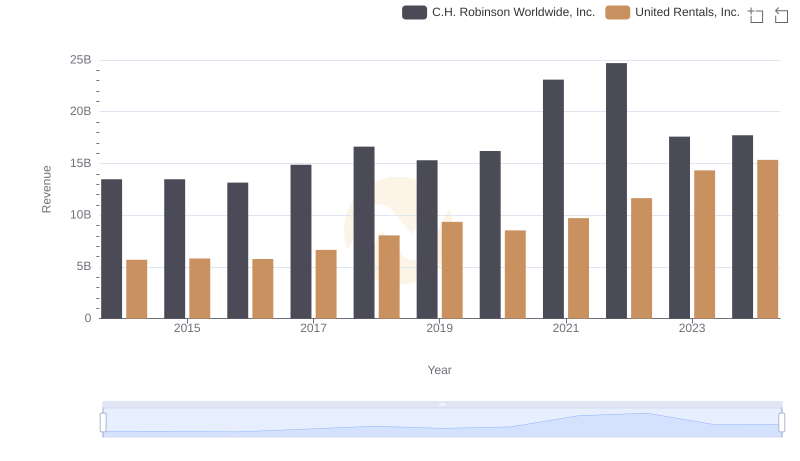
United Rentals, Inc. vs C.H. Robinson Worldwide, Inc.: Examining Key Revenue Metrics
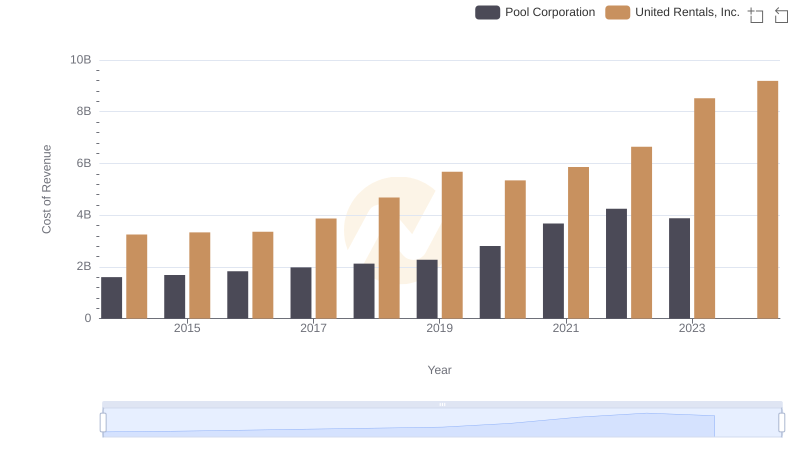
United Rentals, Inc. vs Pool Corporation: Efficiency in Cost of Revenue Explored
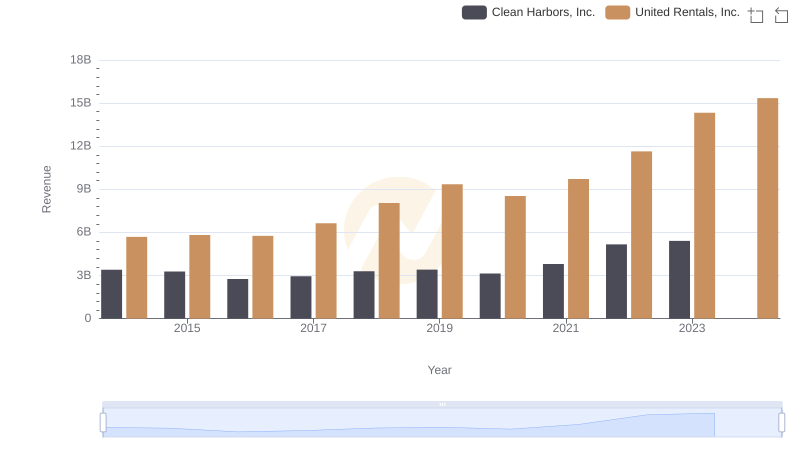
Breaking Down Revenue Trends: United Rentals, Inc. vs Clean Harbors, Inc.
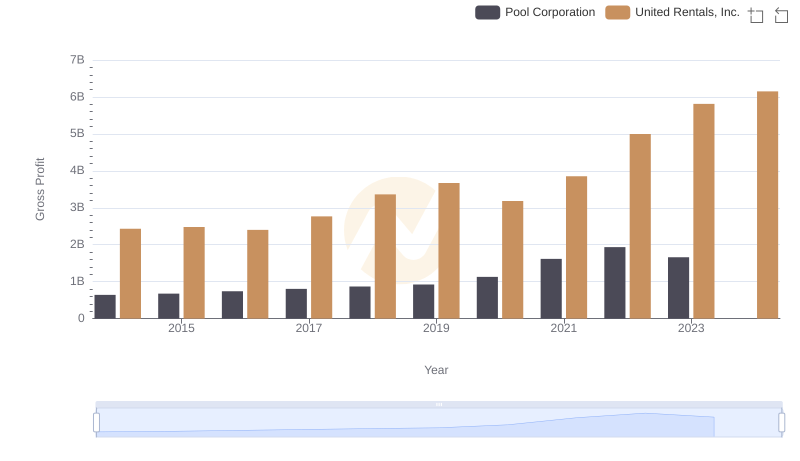
United Rentals, Inc. vs Pool Corporation: A Gross Profit Performance Breakdown
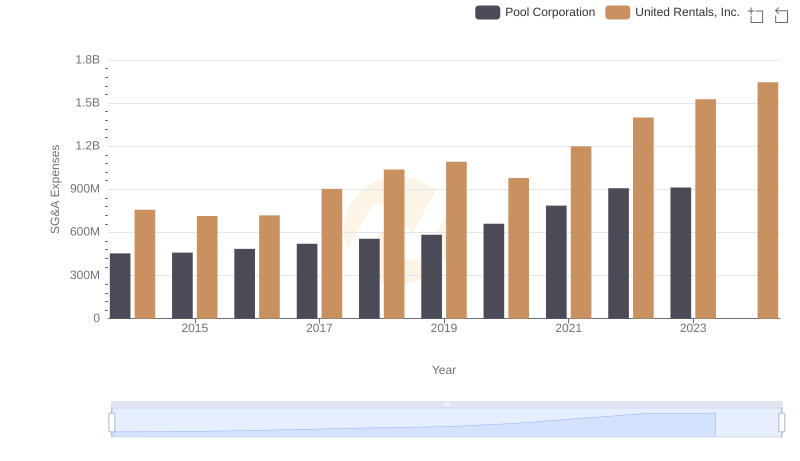
Cost Management Insights: SG&A Expenses for United Rentals, Inc. and Pool Corporation
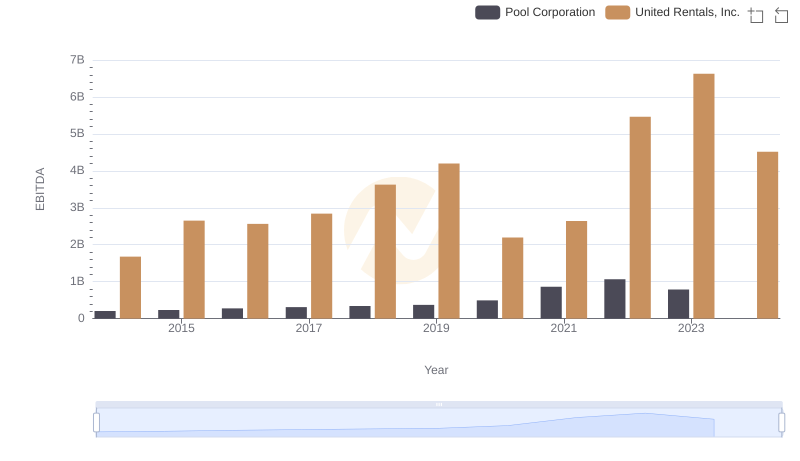
Comparative EBITDA Analysis: United Rentals, Inc. vs Pool Corporation