| __timestamp | Axon Enterprise, Inc. | Builders FirstSource, Inc. |
|---|---|---|
| Wednesday, January 1, 2014 | 54158000 | 306508000 |
| Thursday, January 1, 2015 | 69698000 | 810841000 |
| Friday, January 1, 2016 | 108076000 | 1360412000 |
| Sunday, January 1, 2017 | 138692000 | 1442288000 |
| Monday, January 1, 2018 | 156886000 | 1553972000 |
| Tuesday, January 1, 2019 | 212959000 | 1584523000 |
| Wednesday, January 1, 2020 | 307286000 | 1678730000 |
| Friday, January 1, 2021 | 515007000 | 3463532000 |
| Saturday, January 1, 2022 | 401575000 | 3974173000 |
| Sunday, January 1, 2023 | 496874000 | 3836015000 |
Cracking the code
In the ever-evolving landscape of corporate finance, understanding the trends in Selling, General, and Administrative (SG&A) expenses is crucial for investors and analysts alike. Over the past decade, Axon Enterprise, Inc. and Builders FirstSource, Inc. have shown distinct trajectories in their SG&A expenditures.
From 2014 to 2023, Axon Enterprise, Inc. witnessed a remarkable increase in SG&A expenses, growing by approximately 817%, from $54 million to nearly $497 million. This surge reflects Axon's strategic investments in innovation and market expansion.
Conversely, Builders FirstSource, Inc. experienced a more dramatic rise, with SG&A expenses soaring by over 1,150%, reaching nearly $3.8 billion in 2023. This growth underscores the company's aggressive acquisition strategy and scaling operations.
These trends highlight the contrasting approaches of these industry leaders in managing operational costs while pursuing growth.
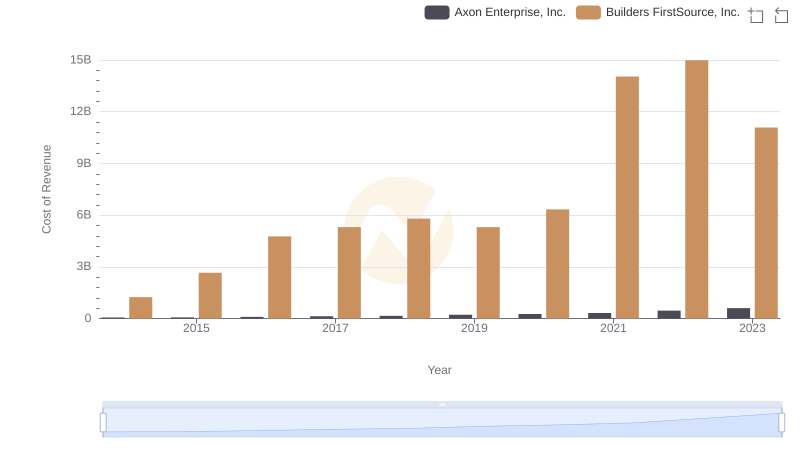
Axon Enterprise, Inc. vs Builders FirstSource, Inc.: Efficiency in Cost of Revenue Explored
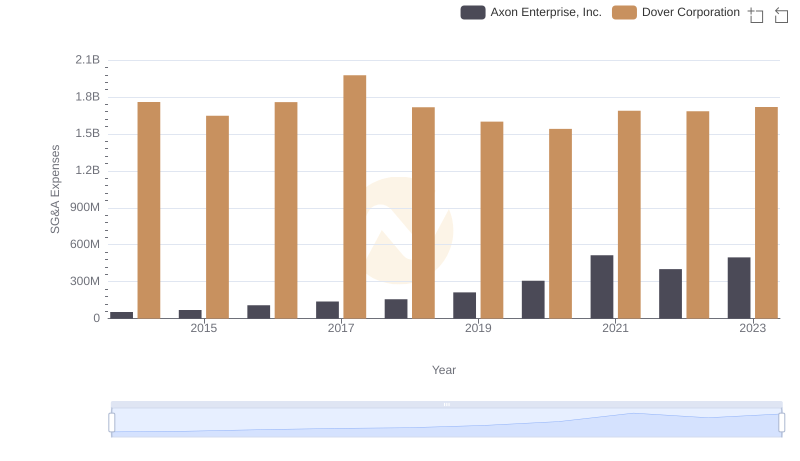
Selling, General, and Administrative Costs: Axon Enterprise, Inc. vs Dover Corporation
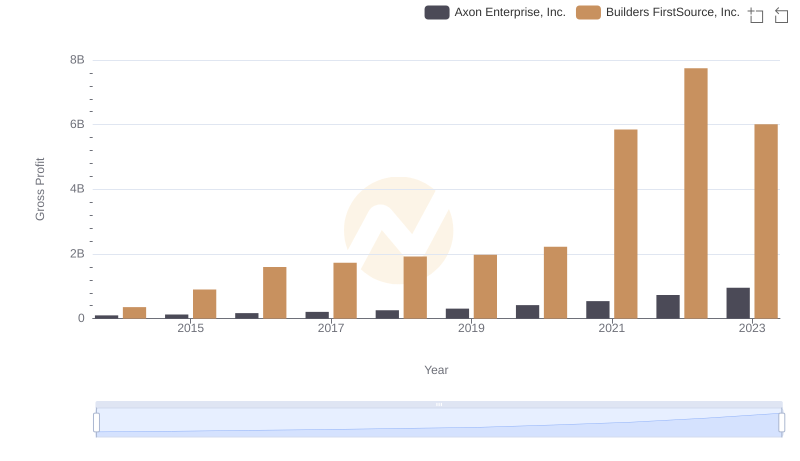
Gross Profit Trends Compared: Axon Enterprise, Inc. vs Builders FirstSource, Inc.
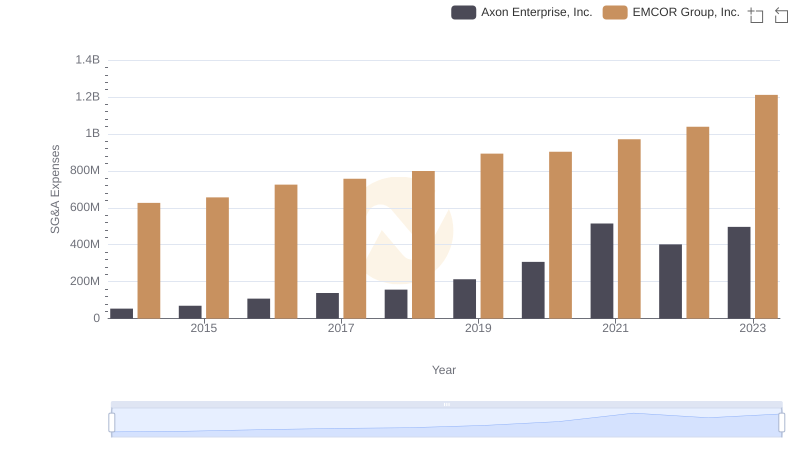
SG&A Efficiency Analysis: Comparing Axon Enterprise, Inc. and EMCOR Group, Inc.
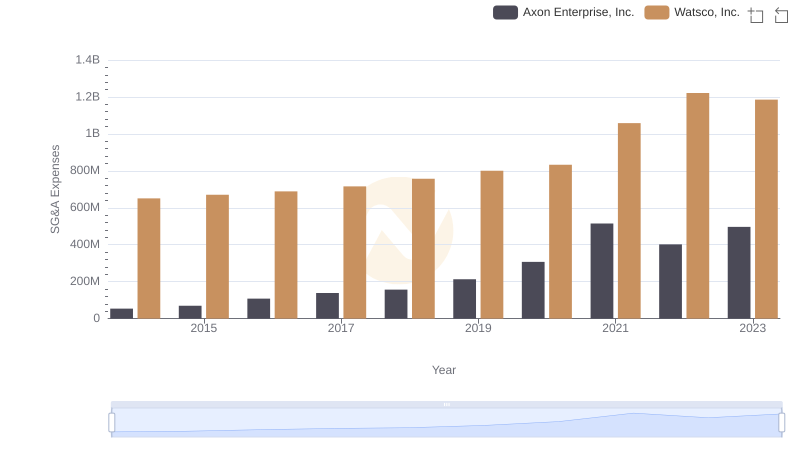
Comparing SG&A Expenses: Axon Enterprise, Inc. vs Watsco, Inc. Trends and Insights
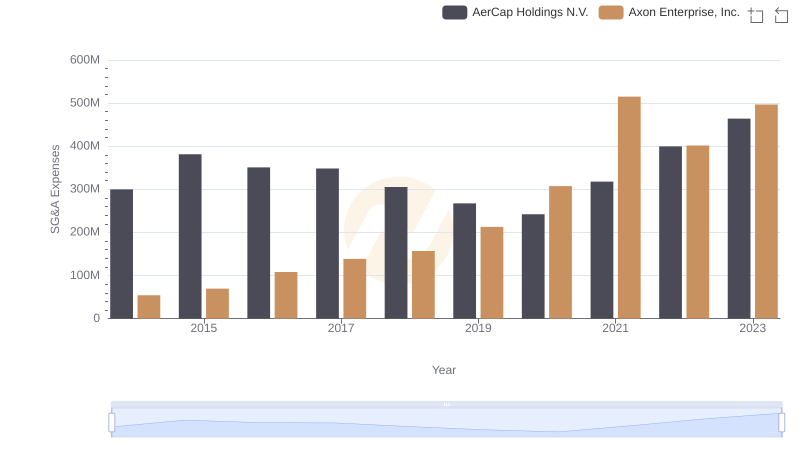
Comparing SG&A Expenses: Axon Enterprise, Inc. vs AerCap Holdings N.V. Trends and Insights
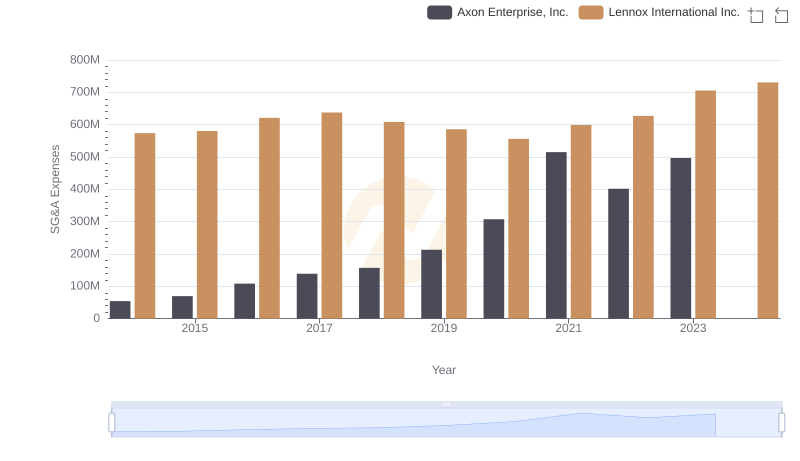
Axon Enterprise, Inc. and Lennox International Inc.: SG&A Spending Patterns Compared
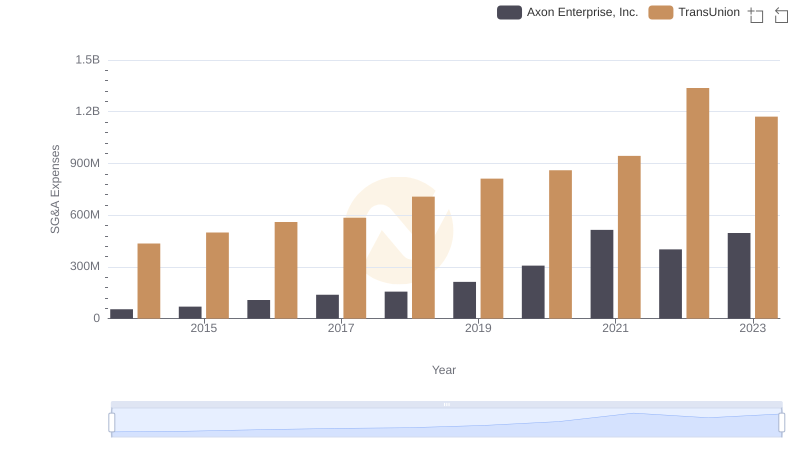
Selling, General, and Administrative Costs: Axon Enterprise, Inc. vs TransUnion
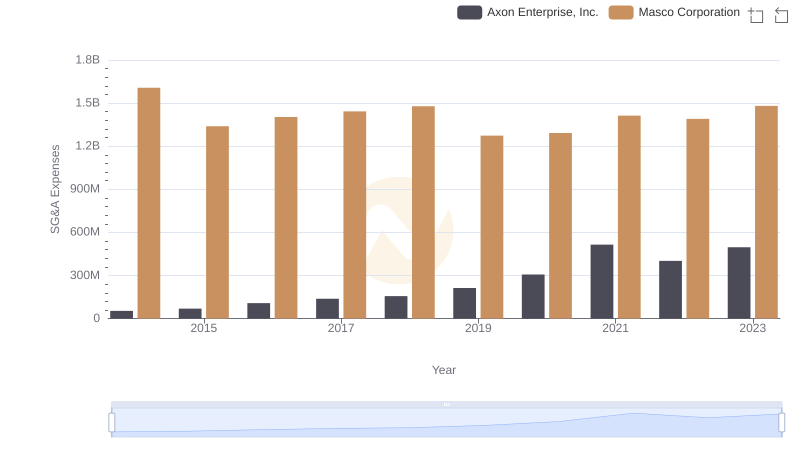
Operational Costs Compared: SG&A Analysis of Axon Enterprise, Inc. and Masco Corporation