| __timestamp | Axon Enterprise, Inc. | Builders FirstSource, Inc. |
|---|---|---|
| Wednesday, January 1, 2014 | 101548000 | 356997000 |
| Thursday, January 1, 2015 | 128647000 | 901458000 |
| Friday, January 1, 2016 | 170536000 | 1596748000 |
| Sunday, January 1, 2017 | 207088000 | 1727391000 |
| Monday, January 1, 2018 | 258583000 | 1922940000 |
| Tuesday, January 1, 2019 | 307286000 | 1976829000 |
| Wednesday, January 1, 2020 | 416331000 | 2222584000 |
| Friday, January 1, 2021 | 540910000 | 5850956000 |
| Saturday, January 1, 2022 | 728638000 | 7744379000 |
| Sunday, January 1, 2023 | 955382000 | 6012334000 |
In pursuit of knowledge
In the ever-evolving landscape of American business, understanding the financial trajectories of key players is crucial. Over the past decade, Axon Enterprise, Inc. and Builders FirstSource, Inc. have demonstrated remarkable growth in their gross profits, reflecting their strategic prowess and market adaptability.
From 2014 to 2023, Axon Enterprise, Inc. saw its gross profit soar by approximately 840%, starting from a modest $101 million to an impressive $955 million. This growth underscores Axon's successful expansion in the public safety technology sector.
Conversely, Builders FirstSource, Inc. experienced a staggering 1,585% increase in gross profit, peaking at $7.74 billion in 2022. This surge highlights the company's dominance in the construction supply industry, driven by robust demand and strategic acquisitions.
These trends not only reflect the companies' individual successes but also provide insights into broader industry dynamics and economic conditions.
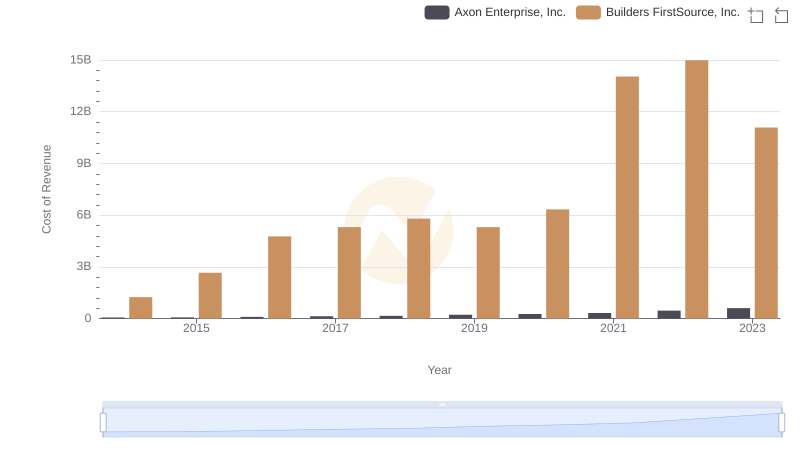
Axon Enterprise, Inc. vs Builders FirstSource, Inc.: Efficiency in Cost of Revenue Explored
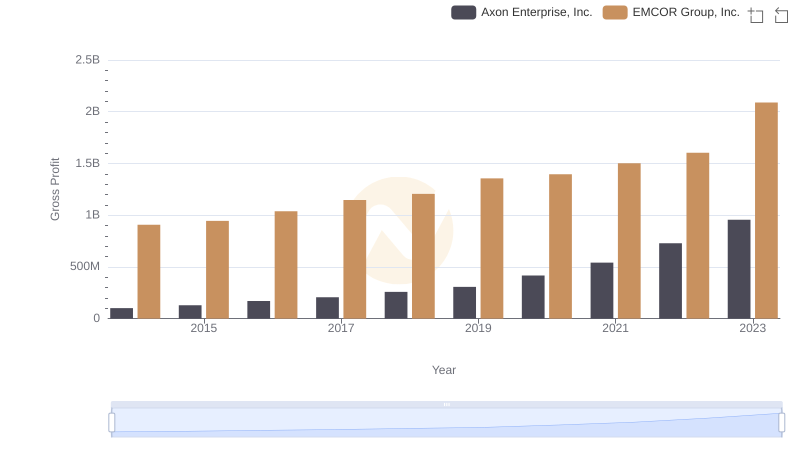
Key Insights on Gross Profit: Axon Enterprise, Inc. vs EMCOR Group, Inc.
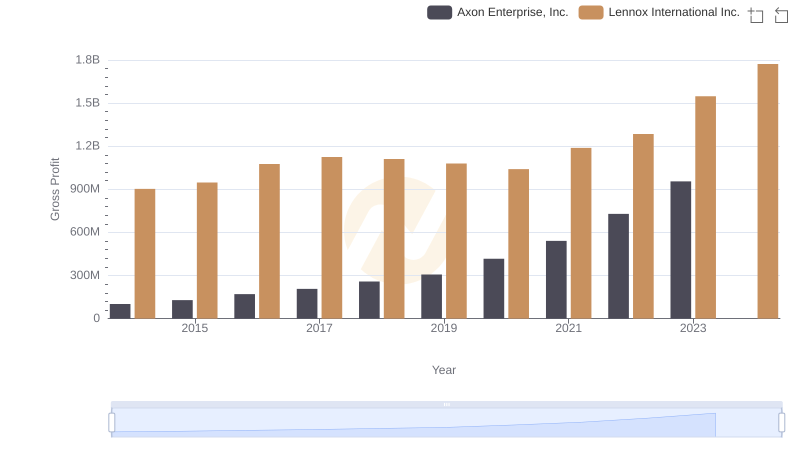
Gross Profit Analysis: Comparing Axon Enterprise, Inc. and Lennox International Inc.
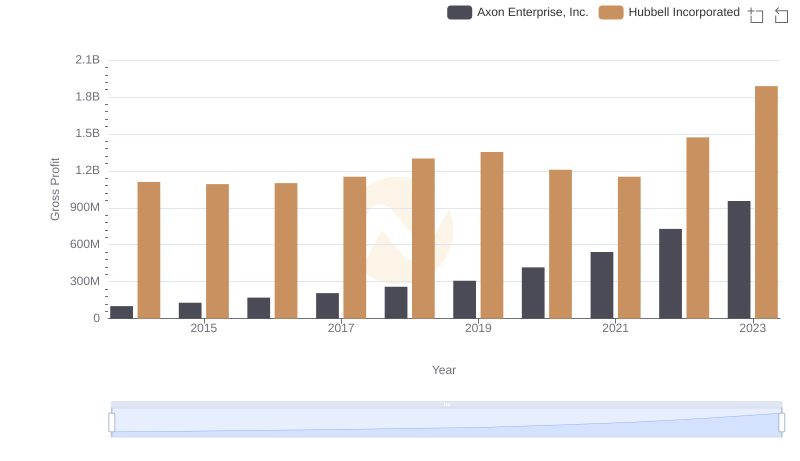
Key Insights on Gross Profit: Axon Enterprise, Inc. vs Hubbell Incorporated
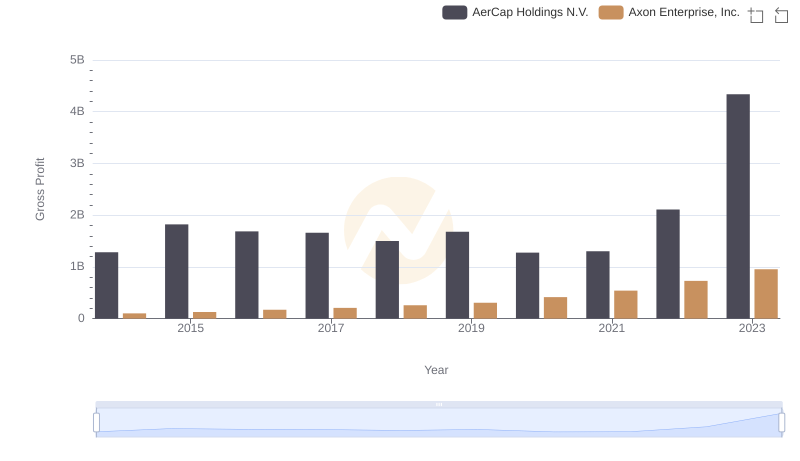
Key Insights on Gross Profit: Axon Enterprise, Inc. vs AerCap Holdings N.V.
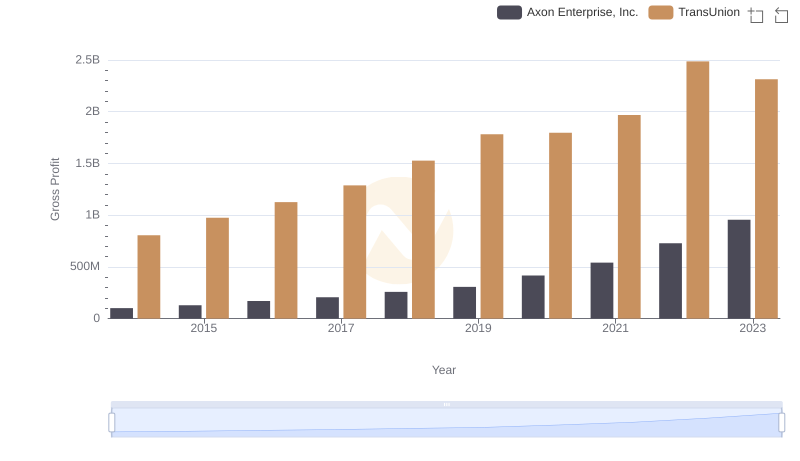
Gross Profit Comparison: Axon Enterprise, Inc. and TransUnion Trends
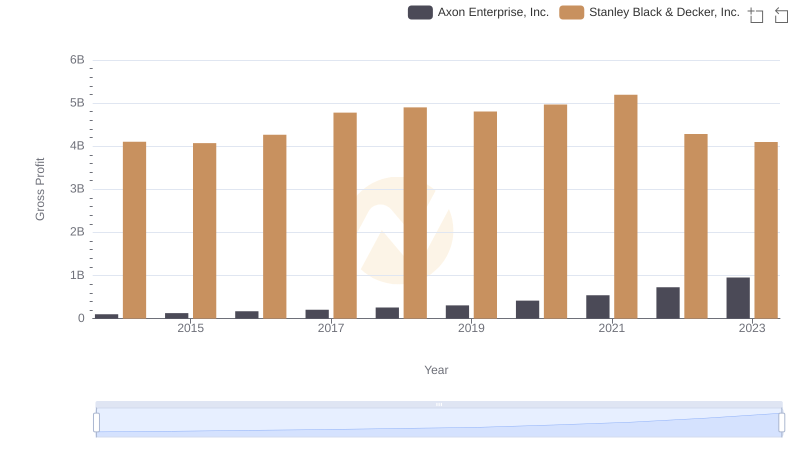
Axon Enterprise, Inc. and Stanley Black & Decker, Inc.: A Detailed Gross Profit Analysis

Axon Enterprise, Inc. vs Builders FirstSource, Inc.: SG&A Expense Trends
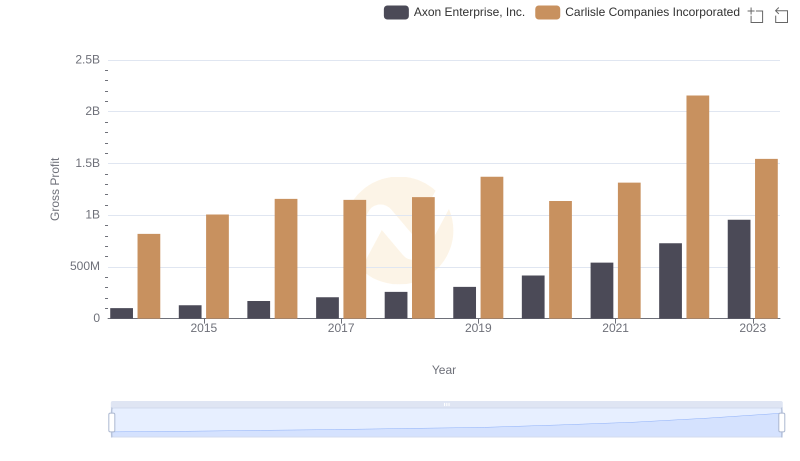
Gross Profit Trends Compared: Axon Enterprise, Inc. vs Carlisle Companies Incorporated