| __timestamp | Automatic Data Processing, Inc. | TransUnion |
|---|---|---|
| Wednesday, January 1, 2014 | 2616900000 | 429400000 |
| Thursday, January 1, 2015 | 2355100000 | 478200000 |
| Friday, January 1, 2016 | 2579500000 | 585300000 |
| Sunday, January 1, 2017 | 2927200000 | 701100000 |
| Monday, January 1, 2018 | 2762900000 | 819800000 |
| Tuesday, January 1, 2019 | 3544500000 | 993200000 |
| Wednesday, January 1, 2020 | 3769700000 | 883400000 |
| Friday, January 1, 2021 | 3931600000 | 1010500000 |
| Saturday, January 1, 2022 | 4405500000 | 1173800000 |
| Sunday, January 1, 2023 | 5244600000 | 667300000 |
| Monday, January 1, 2024 | 5800000000 | 1204100000 |
Unleashing insights
In the world of finance, EBITDA is a key indicator of a company's operational performance. Over the past decade, Automatic Data Processing, Inc. (ADP) has consistently outperformed TransUnion in this metric. From 2014 to 2023, ADP's EBITDA grew by approximately 122%, showcasing its robust financial health and strategic growth initiatives. In contrast, TransUnion's EBITDA increased by about 173% from 2014 to 2022, before experiencing a decline in 2023. This drop could be attributed to market fluctuations or strategic shifts. Notably, ADP's EBITDA in 2023 was nearly eight times that of TransUnion, highlighting its dominant market position. The data for 2024 is incomplete, with TransUnion's figures missing, leaving room for speculation on its future performance. This comparison underscores the importance of strategic planning and market adaptability in maintaining financial growth.
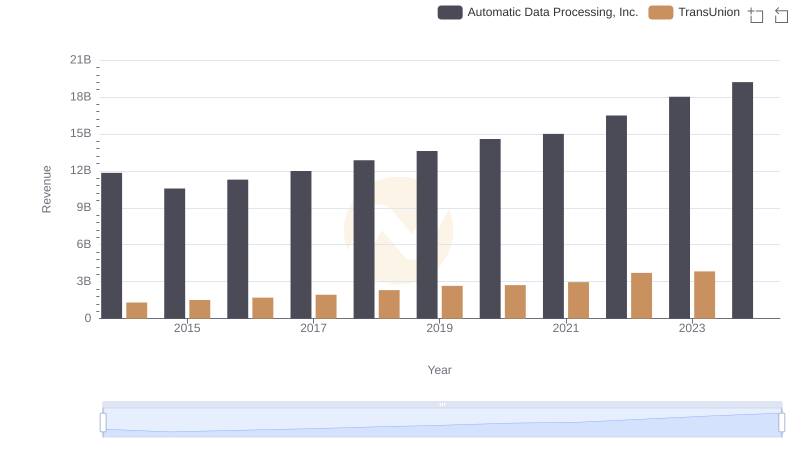
Comparing Revenue Performance: Automatic Data Processing, Inc. or TransUnion?

Cost Insights: Breaking Down Automatic Data Processing, Inc. and TransUnion's Expenses
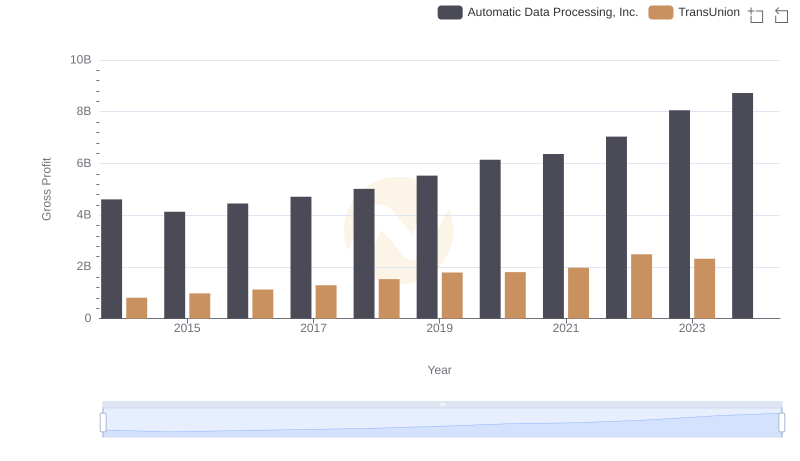
Key Insights on Gross Profit: Automatic Data Processing, Inc. vs TransUnion
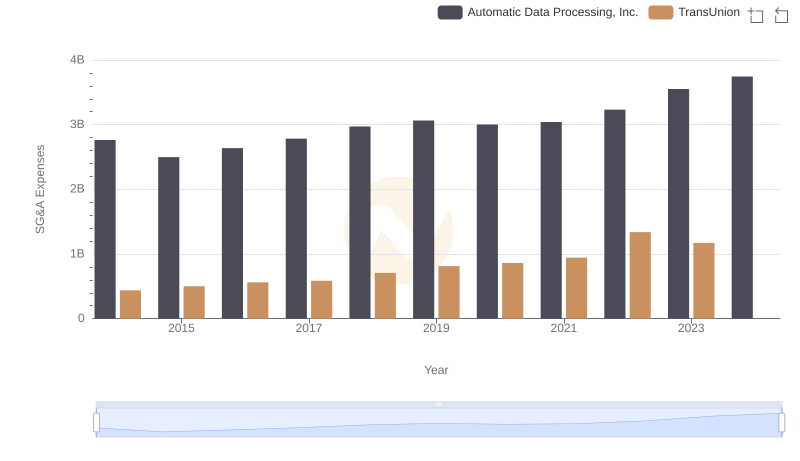
Who Optimizes SG&A Costs Better? Automatic Data Processing, Inc. or TransUnion
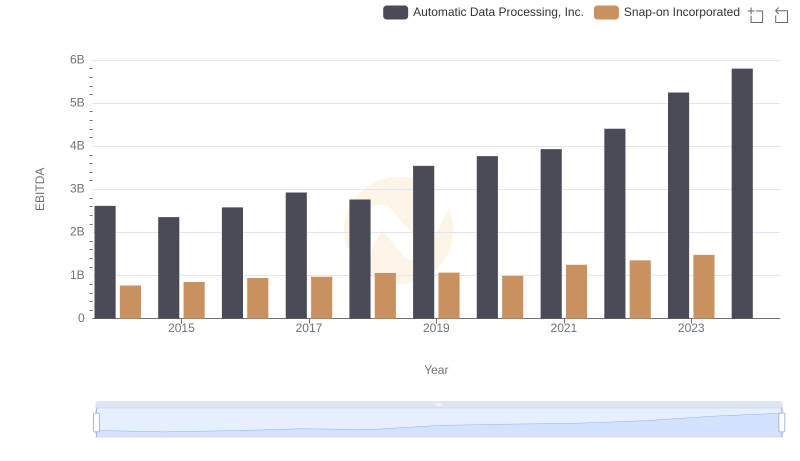
Professional EBITDA Benchmarking: Automatic Data Processing, Inc. vs Snap-on Incorporated
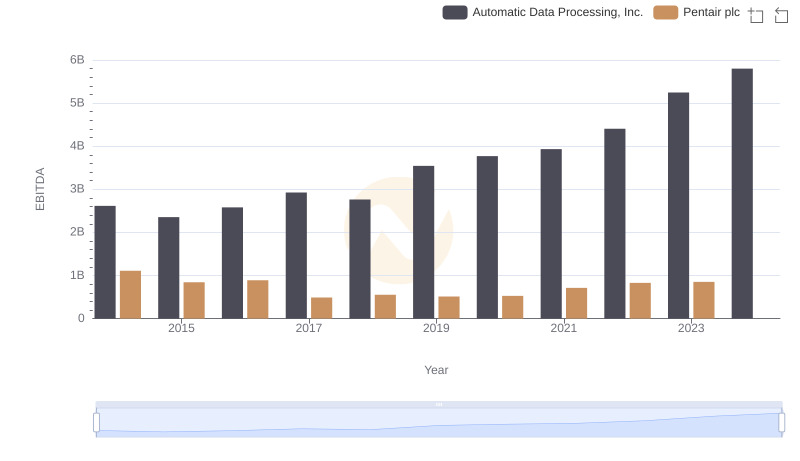
Comprehensive EBITDA Comparison: Automatic Data Processing, Inc. vs Pentair plc
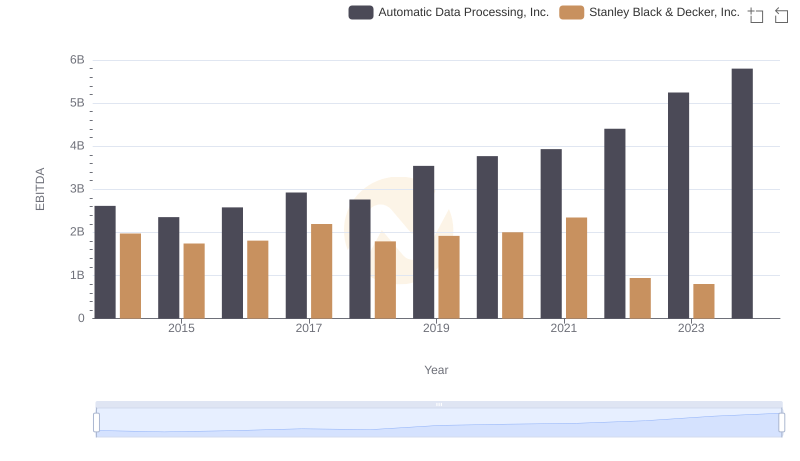
A Side-by-Side Analysis of EBITDA: Automatic Data Processing, Inc. and Stanley Black & Decker, Inc.
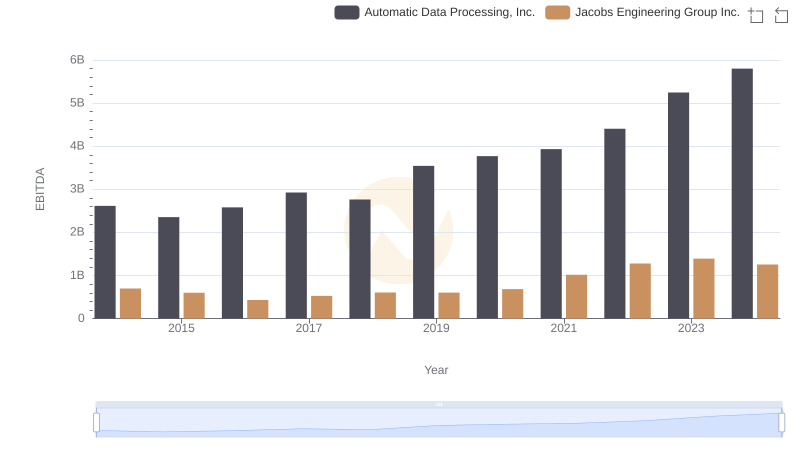
EBITDA Metrics Evaluated: Automatic Data Processing, Inc. vs Jacobs Engineering Group Inc.
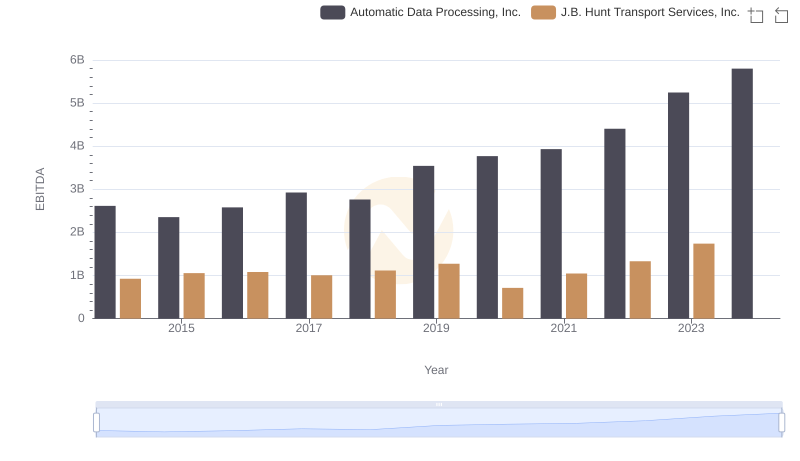
A Professional Review of EBITDA: Automatic Data Processing, Inc. Compared to J.B. Hunt Transport Services, Inc.
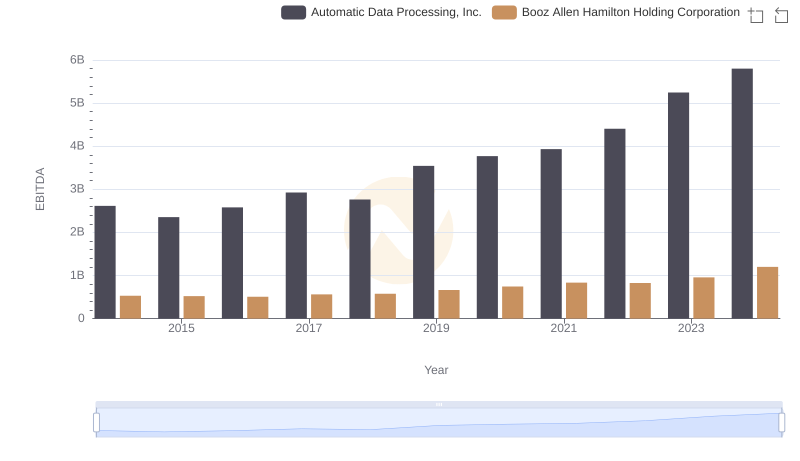
Automatic Data Processing, Inc. and Booz Allen Hamilton Holding Corporation: A Detailed Examination of EBITDA Performance
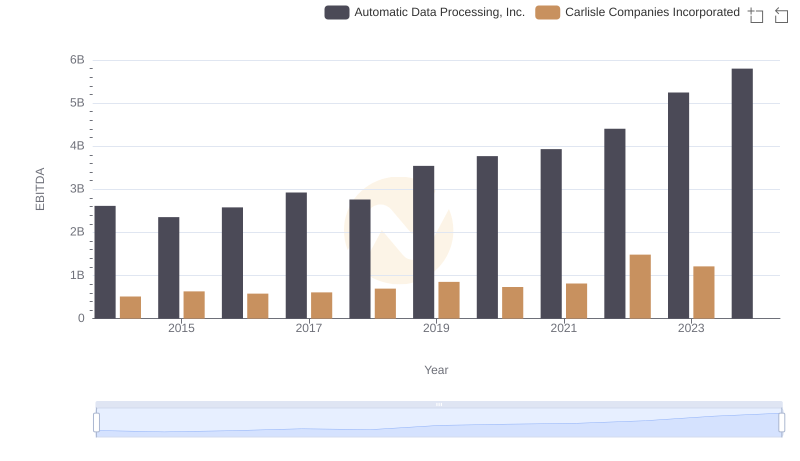
EBITDA Analysis: Evaluating Automatic Data Processing, Inc. Against Carlisle Companies Incorporated