| __timestamp | Automatic Data Processing, Inc. | Stanley Black & Decker, Inc. |
|---|---|---|
| Wednesday, January 1, 2014 | 2616900000 | 1975400000 |
| Thursday, January 1, 2015 | 2355100000 | 1741900000 |
| Friday, January 1, 2016 | 2579500000 | 1810200000 |
| Sunday, January 1, 2017 | 2927200000 | 2196000000 |
| Monday, January 1, 2018 | 2762900000 | 1791200000 |
| Tuesday, January 1, 2019 | 3544500000 | 1920600000 |
| Wednesday, January 1, 2020 | 3769700000 | 2004200000 |
| Friday, January 1, 2021 | 3931600000 | 2345500000 |
| Saturday, January 1, 2022 | 4405500000 | 942800000 |
| Sunday, January 1, 2023 | 5244600000 | 802700000 |
| Monday, January 1, 2024 | 5800000000 | 286300000 |
In pursuit of knowledge
In the ever-evolving landscape of corporate finance, EBITDA serves as a crucial metric for evaluating a company's operational performance. Over the past decade, Automatic Data Processing, Inc. (ADP) has demonstrated a robust growth trajectory, with its EBITDA increasing by approximately 122% from 2014 to 2023. In contrast, Stanley Black & Decker, Inc. has faced a more turbulent journey, with its EBITDA peaking in 2021 before experiencing a significant decline of over 65% by 2023. This divergence highlights ADP's resilience and strategic prowess in navigating market challenges, while Stanley Black & Decker grapples with industry-specific hurdles. As we look to the future, the absence of data for Stanley Black & Decker in 2024 raises questions about its financial outlook, whereas ADP continues to project strength with an anticipated EBITDA of $5.8 billion.
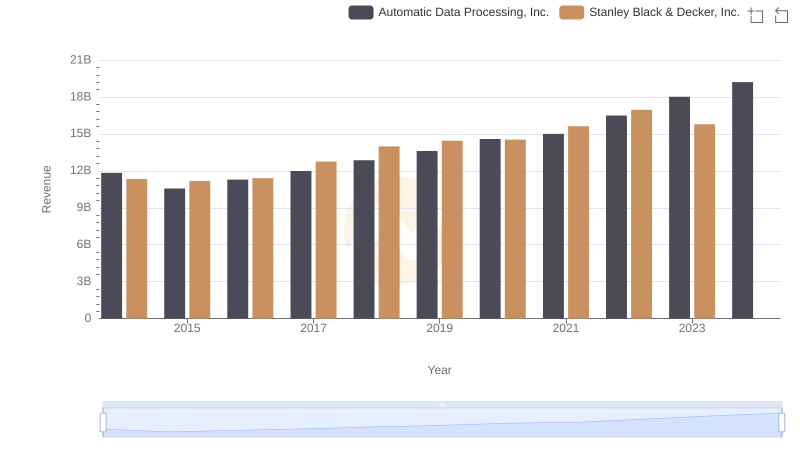
Revenue Insights: Automatic Data Processing, Inc. and Stanley Black & Decker, Inc. Performance Compared
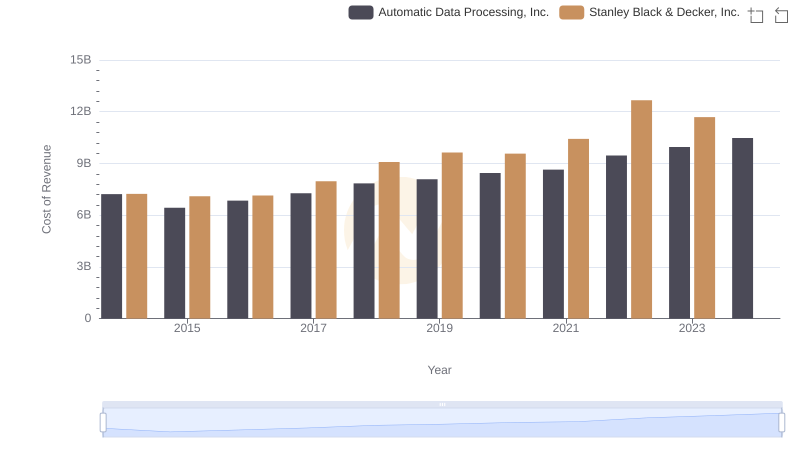
Automatic Data Processing, Inc. vs Stanley Black & Decker, Inc.: Efficiency in Cost of Revenue Explored

Gross Profit Analysis: Comparing Automatic Data Processing, Inc. and Stanley Black & Decker, Inc.
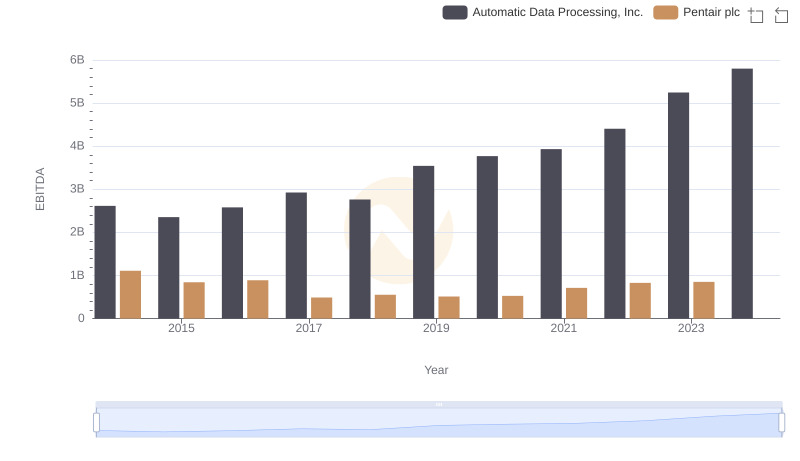
Comprehensive EBITDA Comparison: Automatic Data Processing, Inc. vs Pentair plc
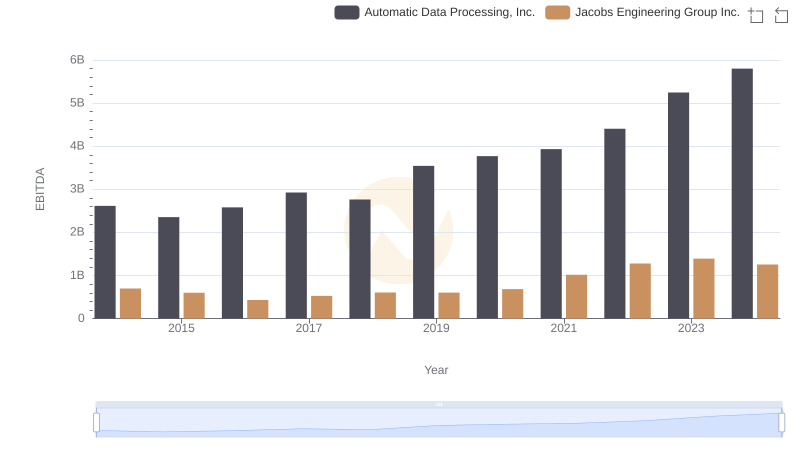
EBITDA Metrics Evaluated: Automatic Data Processing, Inc. vs Jacobs Engineering Group Inc.
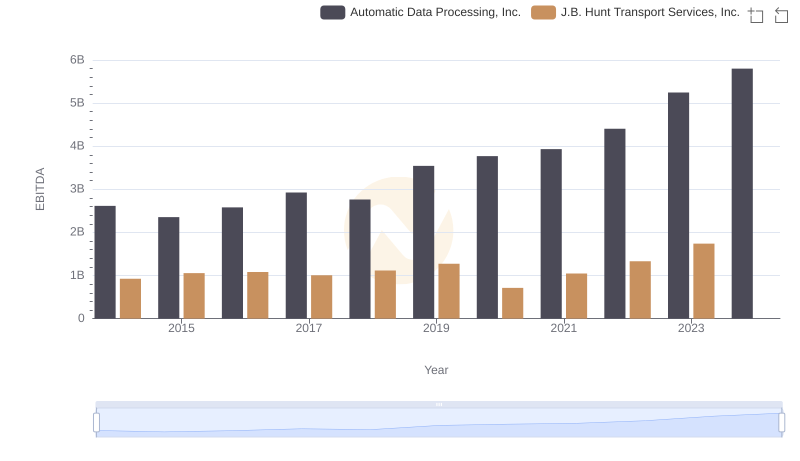
A Professional Review of EBITDA: Automatic Data Processing, Inc. Compared to J.B. Hunt Transport Services, Inc.
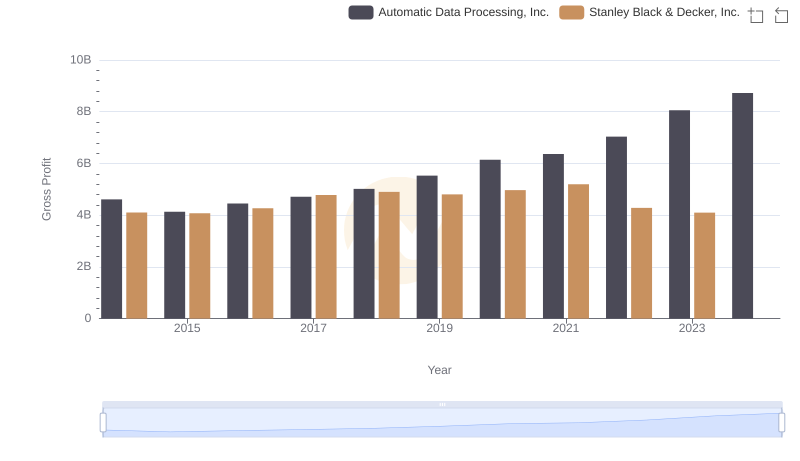
Key Insights on Gross Profit: Automatic Data Processing, Inc. vs Stanley Black & Decker, Inc.

Operational Costs Compared: SG&A Analysis of Automatic Data Processing, Inc. and Stanley Black & Decker, Inc.
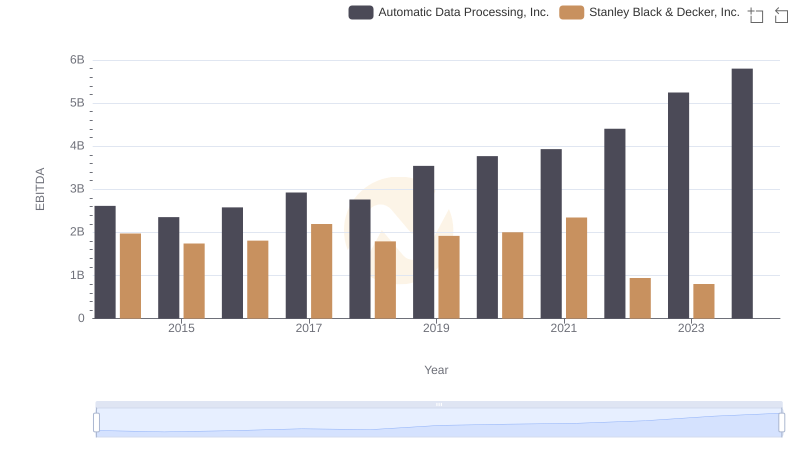
Automatic Data Processing, Inc. vs Stanley Black & Decker, Inc.: In-Depth EBITDA Performance Comparison