| __timestamp | Automatic Data Processing, Inc. | Jacobs Engineering Group Inc. |
|---|---|---|
| Wednesday, January 1, 2014 | 2616900000 | 699015000 |
| Thursday, January 1, 2015 | 2355100000 | 598932000 |
| Friday, January 1, 2016 | 2579500000 | 431954000 |
| Sunday, January 1, 2017 | 2927200000 | 527765000 |
| Monday, January 1, 2018 | 2762900000 | 606328000 |
| Tuesday, January 1, 2019 | 3544500000 | 604075000 |
| Wednesday, January 1, 2020 | 3769700000 | 685042000 |
| Friday, January 1, 2021 | 3931600000 | 1019116000 |
| Saturday, January 1, 2022 | 4405500000 | 1277649000 |
| Sunday, January 1, 2023 | 5244600000 | 1392039000 |
| Monday, January 1, 2024 | 5800000000 | 1255083000 |
Unveiling the hidden dimensions of data
In the ever-evolving landscape of corporate finance, EBITDA serves as a crucial metric for evaluating a company's operational performance. Over the past decade, Automatic Data Processing, Inc. (ADP) and Jacobs Engineering Group Inc. have demonstrated contrasting trajectories in their EBITDA growth.
From 2014 to 2024, ADP's EBITDA has surged by approximately 122%, reflecting its robust business model and strategic initiatives. In contrast, Jacobs Engineering has experienced a more modest growth of around 80% during the same period. Notably, ADP's EBITDA in 2023 reached a peak, nearly quadrupling its 2014 figure, while Jacobs Engineering saw a steady climb, peaking in 2023 before a slight dip in 2024.
This comparison highlights ADP's consistent upward trend, underscoring its resilience and adaptability in a competitive market. Meanwhile, Jacobs Engineering's steady growth trajectory suggests a stable yet less aggressive expansion strategy.
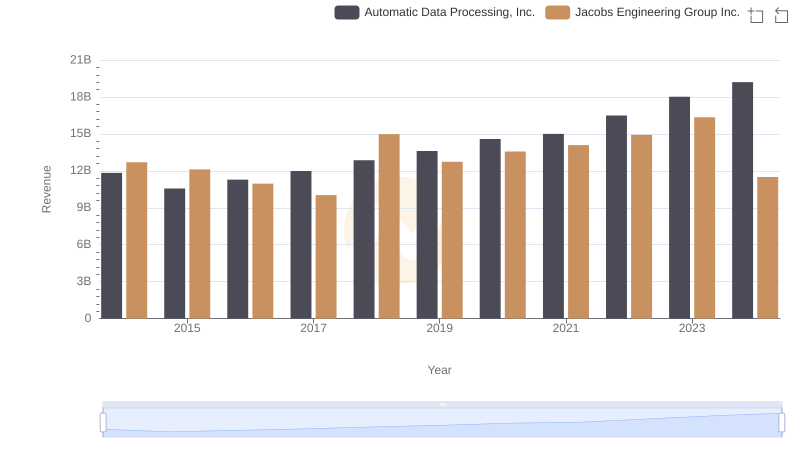
Automatic Data Processing, Inc. or Jacobs Engineering Group Inc.: Who Leads in Yearly Revenue?
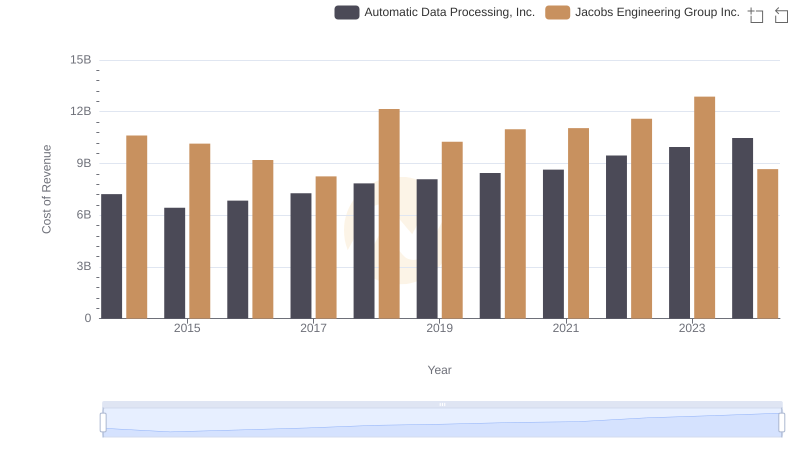
Automatic Data Processing, Inc. vs Jacobs Engineering Group Inc.: Efficiency in Cost of Revenue Explored
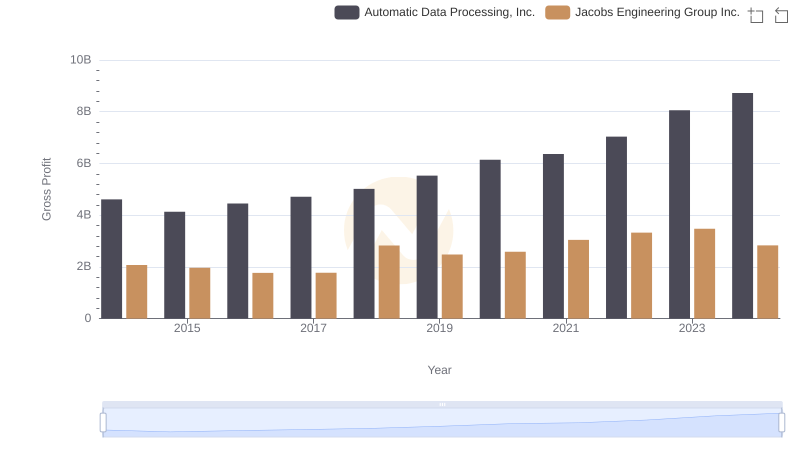
Automatic Data Processing, Inc. vs Jacobs Engineering Group Inc.: A Gross Profit Performance Breakdown
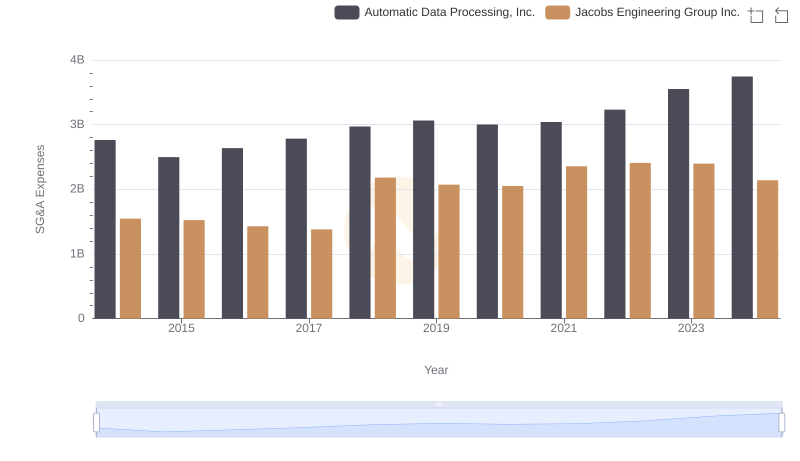
Who Optimizes SG&A Costs Better? Automatic Data Processing, Inc. or Jacobs Engineering Group Inc.
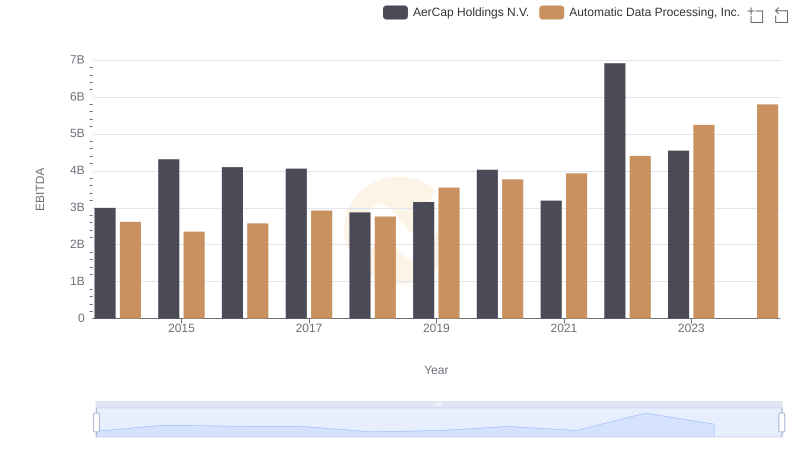
Professional EBITDA Benchmarking: Automatic Data Processing, Inc. vs AerCap Holdings N.V.
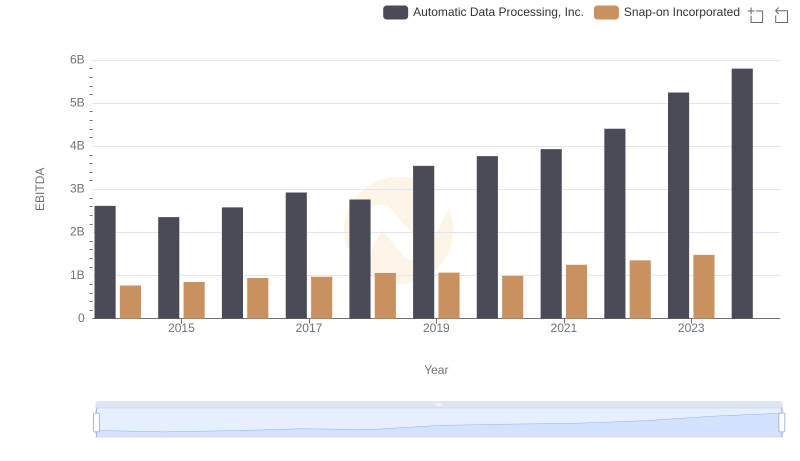
Professional EBITDA Benchmarking: Automatic Data Processing, Inc. vs Snap-on Incorporated
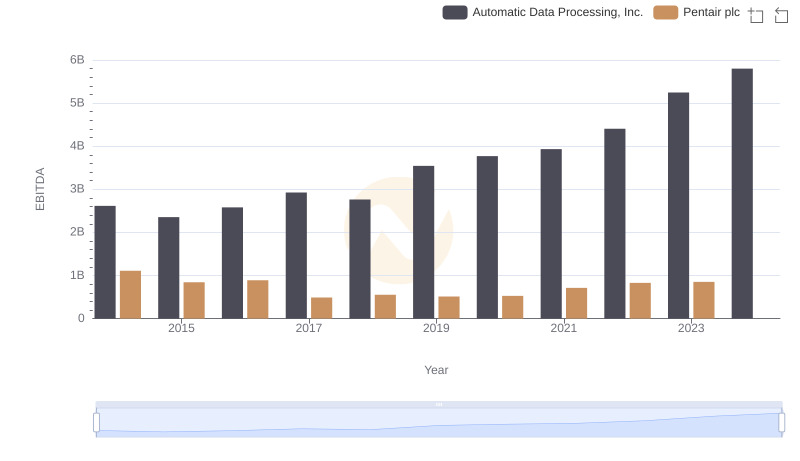
Comprehensive EBITDA Comparison: Automatic Data Processing, Inc. vs Pentair plc
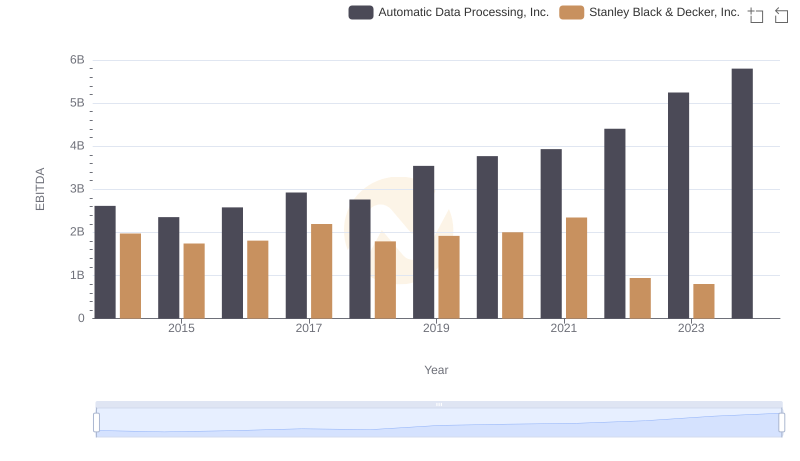
A Side-by-Side Analysis of EBITDA: Automatic Data Processing, Inc. and Stanley Black & Decker, Inc.
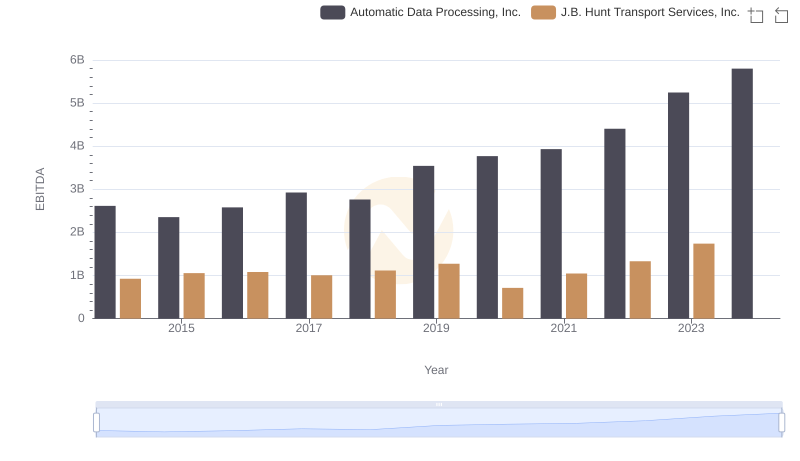
A Professional Review of EBITDA: Automatic Data Processing, Inc. Compared to J.B. Hunt Transport Services, Inc.
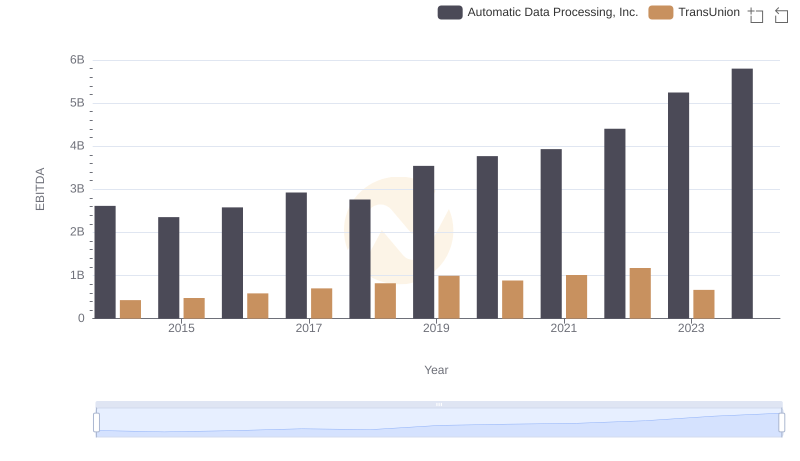
Automatic Data Processing, Inc. vs TransUnion: In-Depth EBITDA Performance Comparison
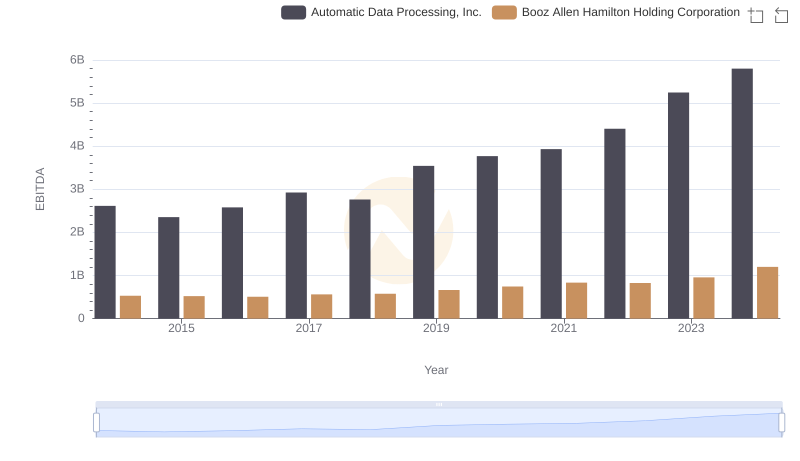
Automatic Data Processing, Inc. and Booz Allen Hamilton Holding Corporation: A Detailed Examination of EBITDA Performance