| __timestamp | Automatic Data Processing, Inc. | TransUnion |
|---|---|---|
| Wednesday, January 1, 2014 | 4611400000 | 805600000 |
| Thursday, January 1, 2015 | 4133200000 | 975200000 |
| Friday, January 1, 2016 | 4450200000 | 1125800000 |
| Sunday, January 1, 2017 | 4712600000 | 1288100000 |
| Monday, January 1, 2018 | 5016700000 | 1527100000 |
| Tuesday, January 1, 2019 | 5526700000 | 1782000000 |
| Wednesday, January 1, 2020 | 6144700000 | 1796200000 |
| Friday, January 1, 2021 | 6365100000 | 1968600000 |
| Saturday, January 1, 2022 | 7036400000 | 2487000000 |
| Sunday, January 1, 2023 | 8058800000 | 2313900000 |
| Monday, January 1, 2024 | 8725900000 | 4183800000 |
Data in motion
In the ever-evolving landscape of financial services, Automatic Data Processing, Inc. (ADP) and TransUnion have showcased remarkable growth in gross profit over the past decade. From 2014 to 2023, ADP's gross profit surged by approximately 89%, reflecting its robust business model and strategic market positioning. In contrast, TransUnion experienced a significant 187% increase, highlighting its aggressive expansion and adaptation to market demands.
While ADP's data for 2024 is available, TransUnion's is notably absent, leaving room for speculation on its future performance.
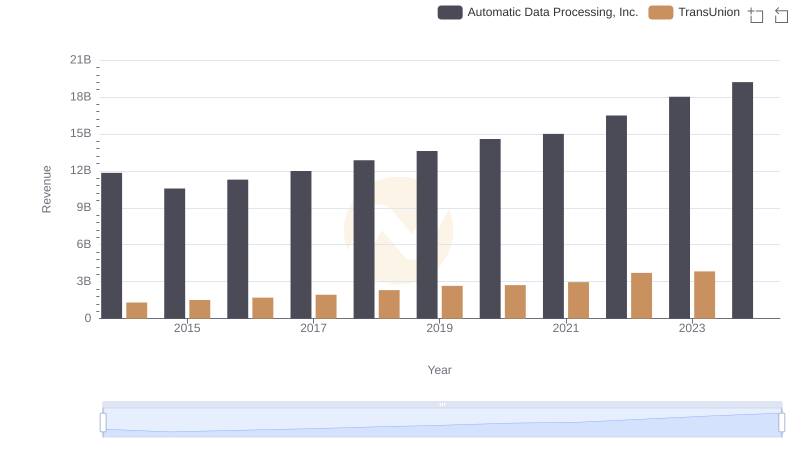
Comparing Revenue Performance: Automatic Data Processing, Inc. or TransUnion?

Cost Insights: Breaking Down Automatic Data Processing, Inc. and TransUnion's Expenses
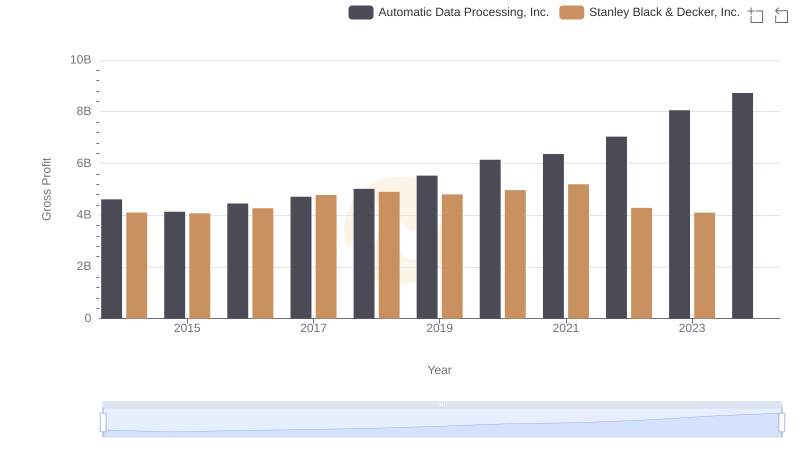
Gross Profit Analysis: Comparing Automatic Data Processing, Inc. and Stanley Black & Decker, Inc.
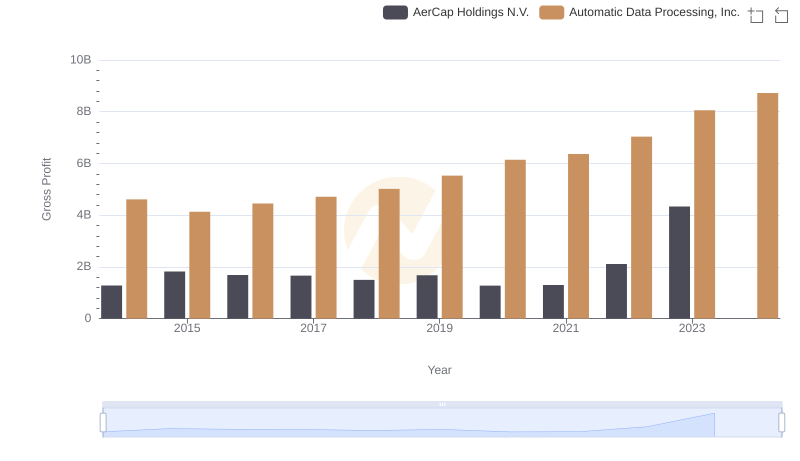
Key Insights on Gross Profit: Automatic Data Processing, Inc. vs AerCap Holdings N.V.
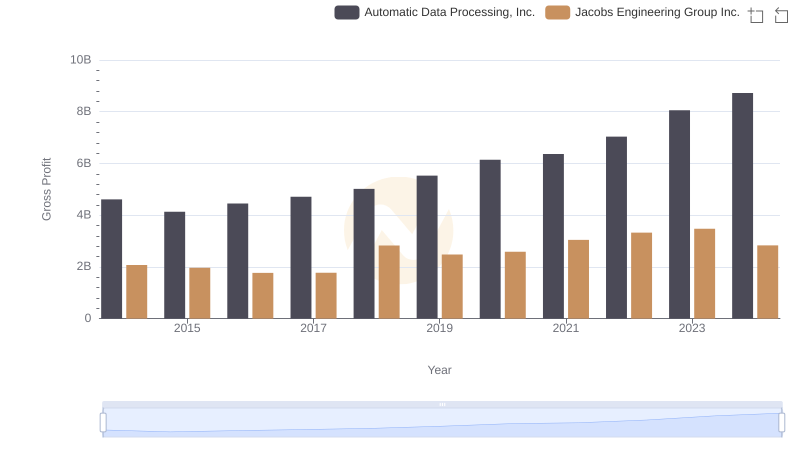
Automatic Data Processing, Inc. vs Jacobs Engineering Group Inc.: A Gross Profit Performance Breakdown
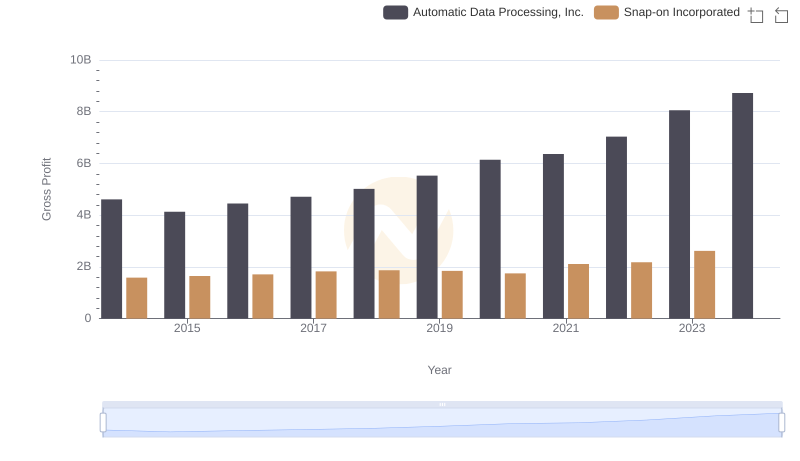
Automatic Data Processing, Inc. and Snap-on Incorporated: A Detailed Gross Profit Analysis
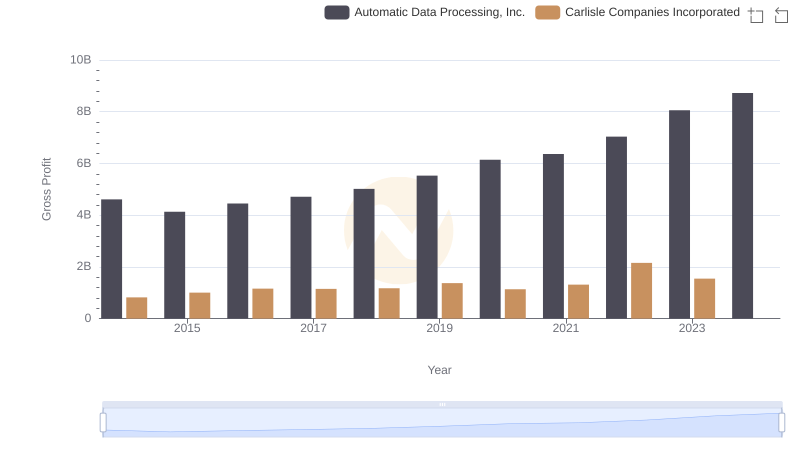
Who Generates Higher Gross Profit? Automatic Data Processing, Inc. or Carlisle Companies Incorporated

Automatic Data Processing, Inc. and J.B. Hunt Transport Services, Inc.: A Detailed Gross Profit Analysis
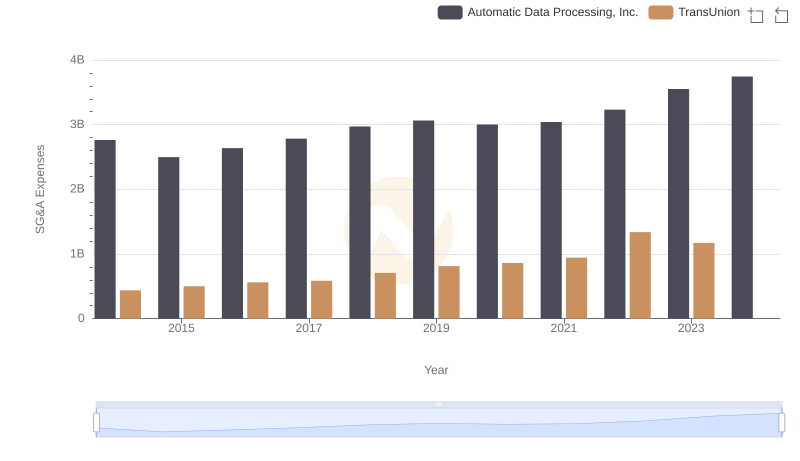
Who Optimizes SG&A Costs Better? Automatic Data Processing, Inc. or TransUnion
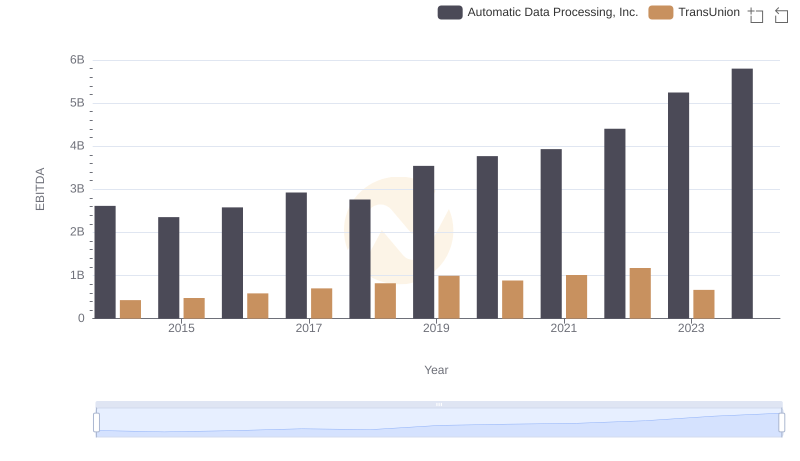
Automatic Data Processing, Inc. vs TransUnion: In-Depth EBITDA Performance Comparison