| __timestamp | Automatic Data Processing, Inc. | J.B. Hunt Transport Services, Inc. |
|---|---|---|
| Wednesday, January 1, 2014 | 2616900000 | 926038000 |
| Thursday, January 1, 2015 | 2355100000 | 1055307000 |
| Friday, January 1, 2016 | 2579500000 | 1082601000 |
| Sunday, January 1, 2017 | 2927200000 | 1007307000 |
| Monday, January 1, 2018 | 2762900000 | 1116914000 |
| Tuesday, January 1, 2019 | 3544500000 | 1274241000 |
| Wednesday, January 1, 2020 | 3769700000 | 713119000 |
| Friday, January 1, 2021 | 3931600000 | 1045530000 |
| Saturday, January 1, 2022 | 4405500000 | 1331553000 |
| Sunday, January 1, 2023 | 5244600000 | 1738774000 |
| Monday, January 1, 2024 | 5800000000 |
Cracking the code
In the ever-evolving landscape of corporate finance, EBITDA serves as a crucial metric for evaluating a company's operational performance. Over the past decade, Automatic Data Processing, Inc. (ADP) and J.B. Hunt Transport Services, Inc. have demonstrated contrasting trajectories in their EBITDA growth. From 2014 to 2023, ADP's EBITDA surged by approximately 122%, reflecting its robust business model and strategic initiatives. In contrast, J.B. Hunt experienced a more modest growth of around 88% during the same period, highlighting the challenges faced in the transportation sector.
The data reveals a significant leap for ADP in 2023, with a 19% increase from the previous year, while J.B. Hunt's EBITDA peaked in 2023, marking a 30% rise. However, data for 2024 remains incomplete, leaving room for speculation on future trends. This analysis underscores the dynamic nature of these industries and the importance of strategic adaptability.

Automatic Data Processing, Inc. or J.B. Hunt Transport Services, Inc.: Who Leads in Yearly Revenue?

Automatic Data Processing, Inc. and J.B. Hunt Transport Services, Inc.: A Detailed Gross Profit Analysis
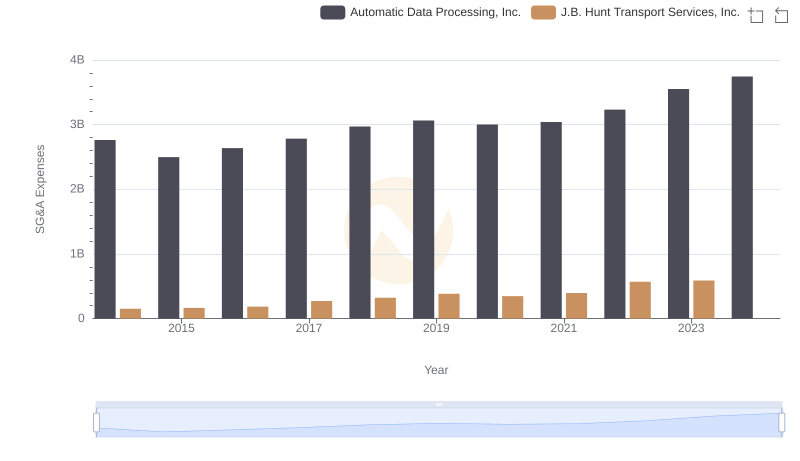
Selling, General, and Administrative Costs: Automatic Data Processing, Inc. vs J.B. Hunt Transport Services, Inc.
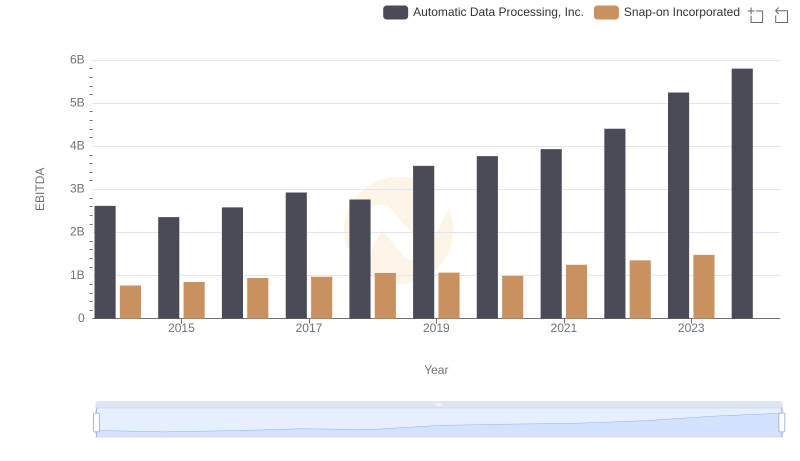
Professional EBITDA Benchmarking: Automatic Data Processing, Inc. vs Snap-on Incorporated
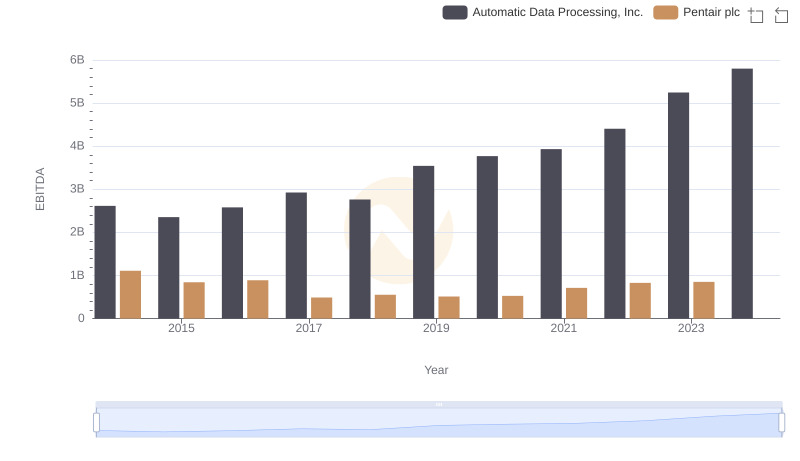
Comprehensive EBITDA Comparison: Automatic Data Processing, Inc. vs Pentair plc
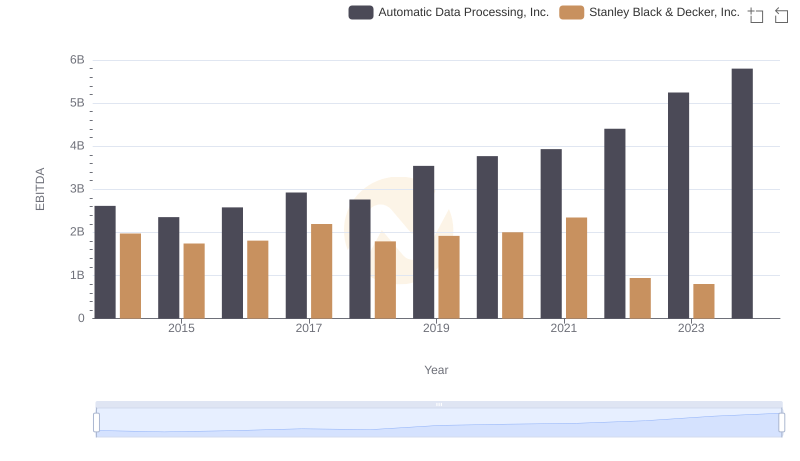
A Side-by-Side Analysis of EBITDA: Automatic Data Processing, Inc. and Stanley Black & Decker, Inc.
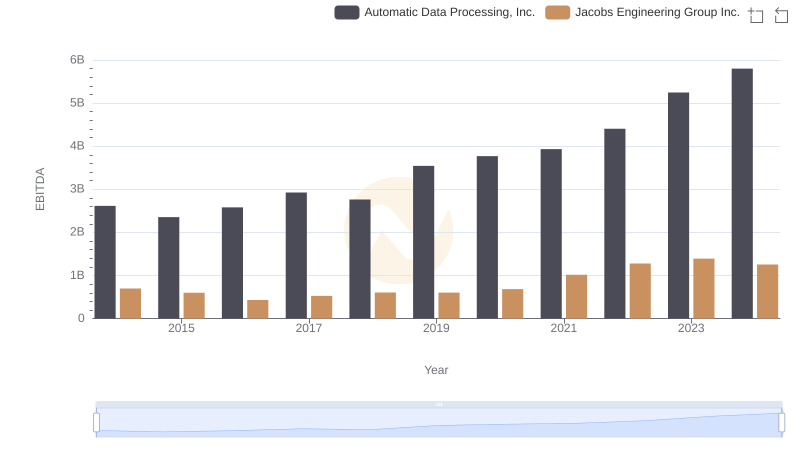
EBITDA Metrics Evaluated: Automatic Data Processing, Inc. vs Jacobs Engineering Group Inc.
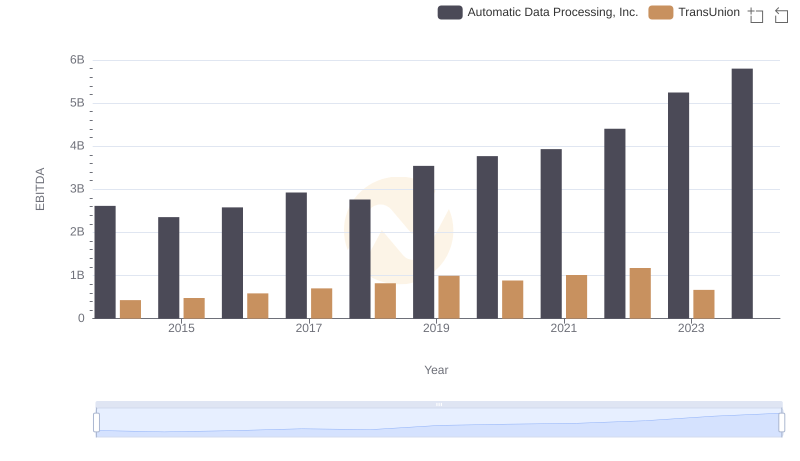
Automatic Data Processing, Inc. vs TransUnion: In-Depth EBITDA Performance Comparison
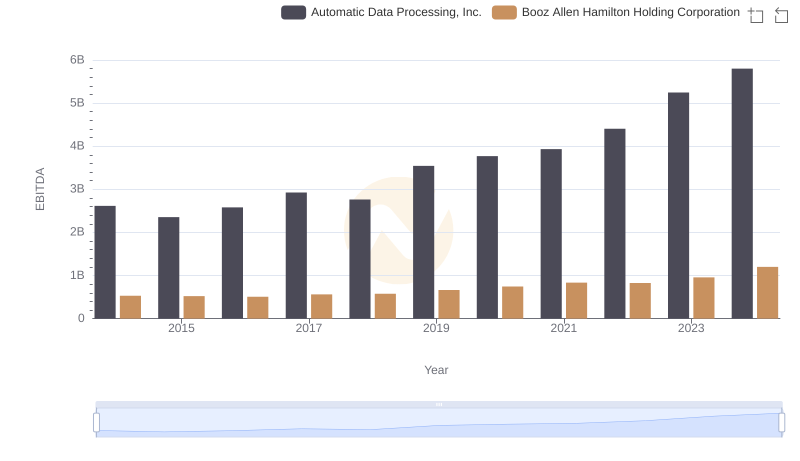
Automatic Data Processing, Inc. and Booz Allen Hamilton Holding Corporation: A Detailed Examination of EBITDA Performance
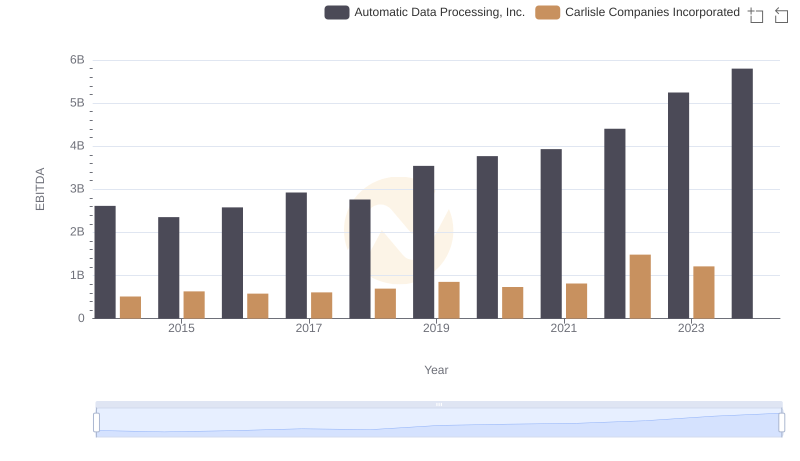
EBITDA Analysis: Evaluating Automatic Data Processing, Inc. Against Carlisle Companies Incorporated