| __timestamp | Rentokil Initial plc | Waste Connections, Inc. |
|---|---|---|
| Wednesday, January 1, 2014 | 297500000 | 1138388000 |
| Thursday, January 1, 2015 | 310200000 | 1177409000 |
| Friday, January 1, 2016 | 376100000 | 1957712000 |
| Sunday, January 1, 2017 | 474900000 | 2704775000 |
| Monday, January 1, 2018 | 514200000 | 2865704000 |
| Tuesday, January 1, 2019 | 2099000000 | 3198757000 |
| Wednesday, January 1, 2020 | 2136400000 | 3276808000 |
| Friday, January 1, 2021 | 2239100000 | 3654074000 |
| Saturday, January 1, 2022 | 2737000000 | 4336012000 |
| Sunday, January 1, 2023 | 927000000 | 4744513000 |
| Monday, January 1, 2024 | 5191706000 |
Unleashing the power of data
In the ever-evolving landscape of waste management and services, understanding cost efficiency is crucial. From 2014 to 2023, Waste Connections, Inc. consistently outperformed Rentokil Initial plc in terms of cost of revenue. Waste Connections, Inc. saw a remarkable increase of over 316% in its cost of revenue, peaking at approximately $4.74 billion in 2023. In contrast, Rentokil Initial plc experienced a more modest growth of around 212%, reaching its highest at $2.74 billion in 2022 before a significant drop in 2023.
This data highlights the strategic financial management of Waste Connections, Inc., which has managed to scale its operations while maintaining cost efficiency. Meanwhile, Rentokil Initial plc's fluctuating costs suggest potential challenges in maintaining consistent growth. As the industry continues to expand, these insights provide a valuable perspective on the financial dynamics at play.
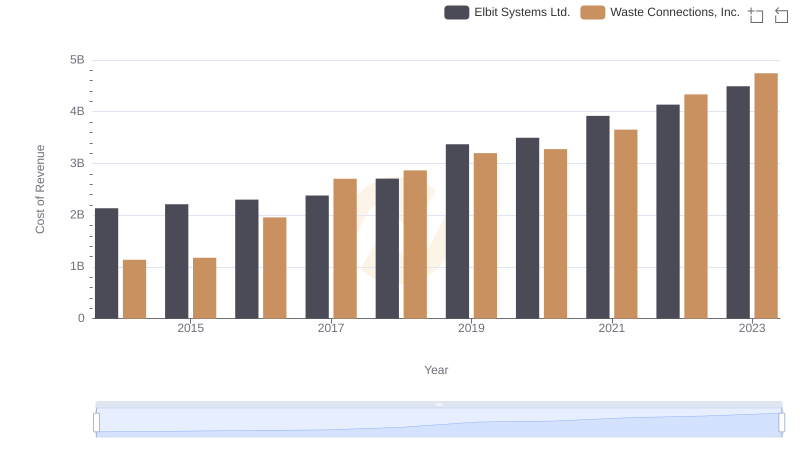
Cost of Revenue Trends: Waste Connections, Inc. vs Elbit Systems Ltd.
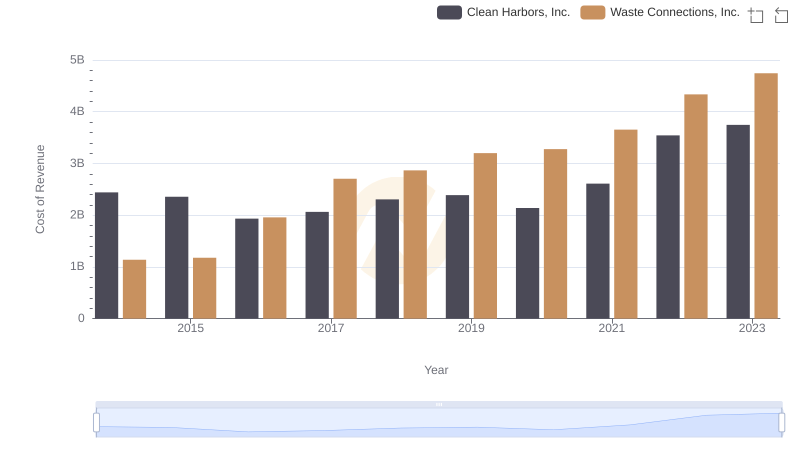
Waste Connections, Inc. vs Clean Harbors, Inc.: Efficiency in Cost of Revenue Explored
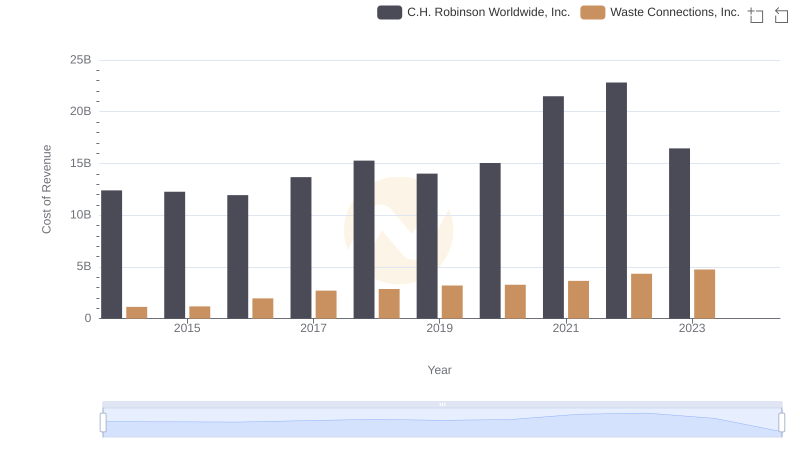
Analyzing Cost of Revenue: Waste Connections, Inc. and C.H. Robinson Worldwide, Inc.
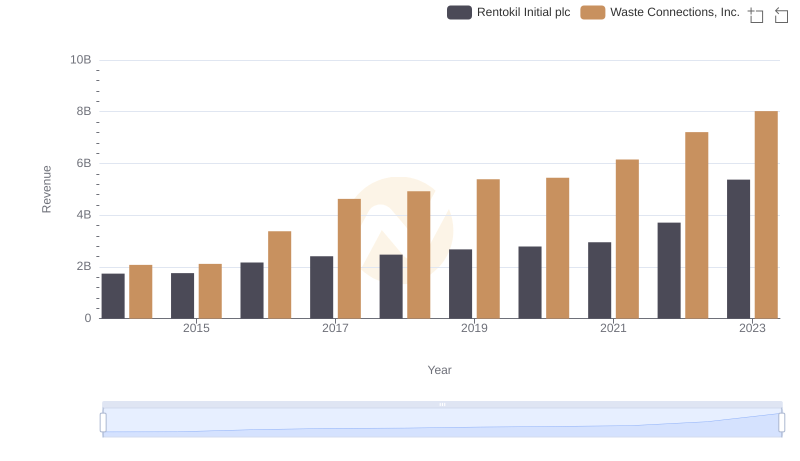
Revenue Insights: Waste Connections, Inc. and Rentokil Initial plc Performance Compared
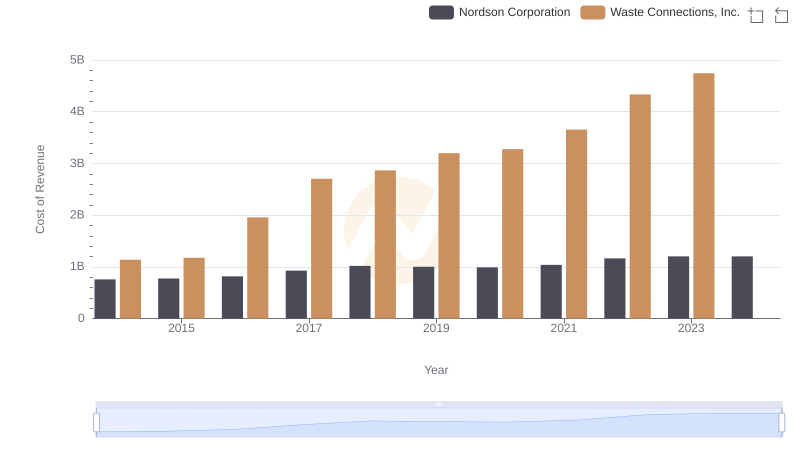
Cost of Revenue Trends: Waste Connections, Inc. vs Nordson Corporation
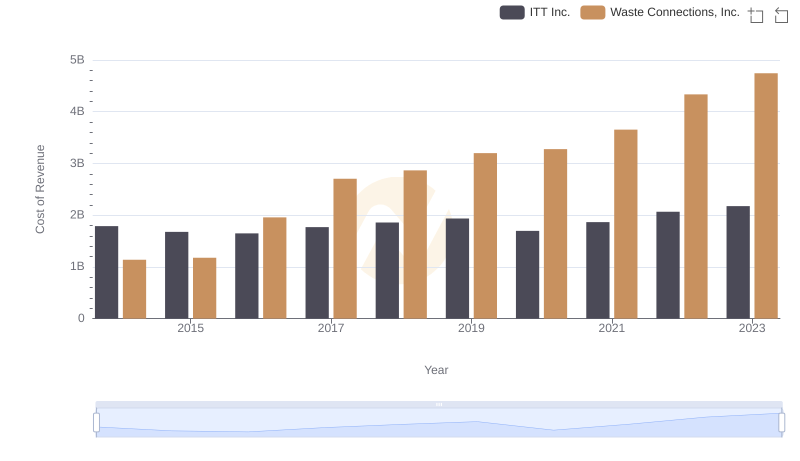
Cost of Revenue Trends: Waste Connections, Inc. vs ITT Inc.
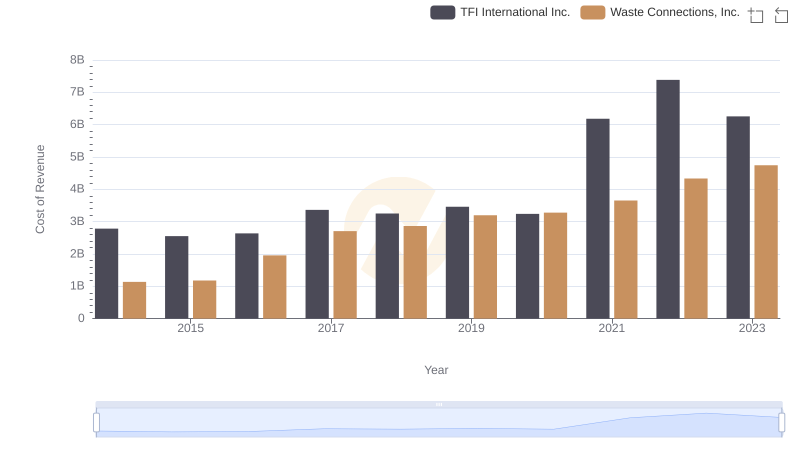
Analyzing Cost of Revenue: Waste Connections, Inc. and TFI International Inc.
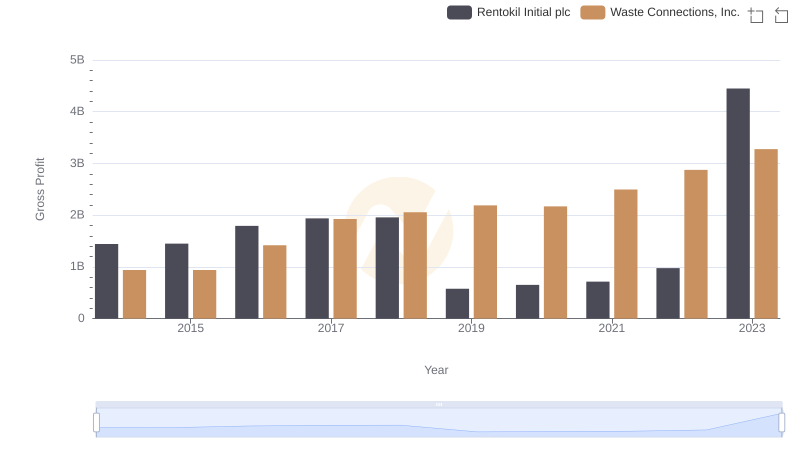
Gross Profit Analysis: Comparing Waste Connections, Inc. and Rentokil Initial plc
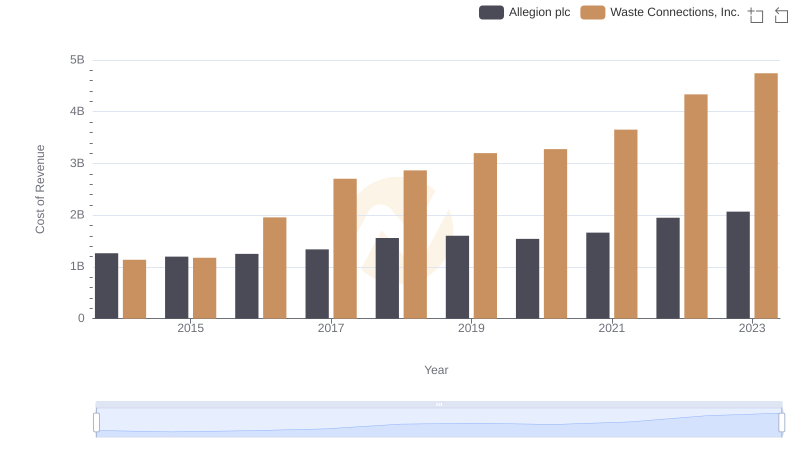
Comparing Cost of Revenue Efficiency: Waste Connections, Inc. vs Allegion plc
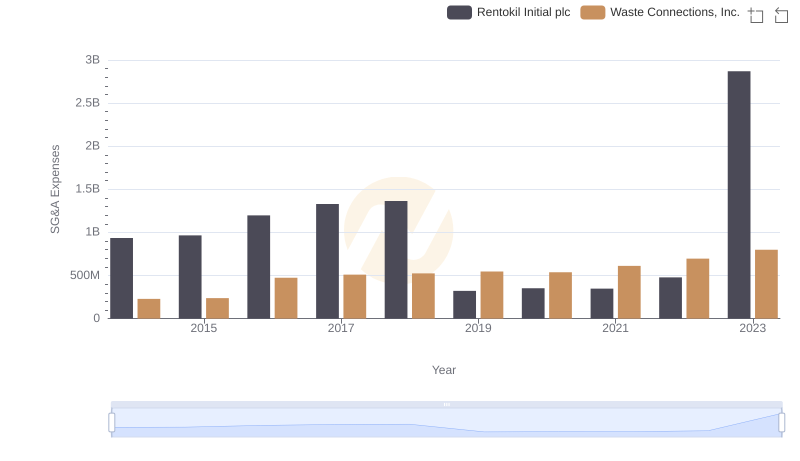
Comparing SG&A Expenses: Waste Connections, Inc. vs Rentokil Initial plc Trends and Insights

Comparative EBITDA Analysis: Waste Connections, Inc. vs Rentokil Initial plc