| __timestamp | Rentokil Initial plc | Waste Connections, Inc. |
|---|---|---|
| Wednesday, January 1, 2014 | 1740800000 | 2079166000 |
| Thursday, January 1, 2015 | 1759000000 | 2117287000 |
| Friday, January 1, 2016 | 2168100000 | 3375863000 |
| Sunday, January 1, 2017 | 2412300000 | 4630488000 |
| Monday, January 1, 2018 | 2472300000 | 4922941000 |
| Tuesday, January 1, 2019 | 2676200000 | 5388679000 |
| Wednesday, January 1, 2020 | 2789400000 | 5445990000 |
| Friday, January 1, 2021 | 2953900000 | 6151361000 |
| Saturday, January 1, 2022 | 3714000000 | 7211859000 |
| Sunday, January 1, 2023 | 5375000000 | 8021951000 |
| Monday, January 1, 2024 | 8919591000 |
Unlocking the unknown
In the dynamic world of waste management and pest control, Waste Connections, Inc. and Rentokil Initial plc have emerged as industry leaders. Over the past decade, Waste Connections, Inc. has consistently outperformed Rentokil Initial plc in revenue growth. From 2014 to 2023, Waste Connections, Inc. saw its revenue soar by approximately 286%, reaching a peak of $8 billion in 2023. In contrast, Rentokil Initial plc experienced a more modest growth of around 209%, culminating in a revenue of $5.4 billion in the same year.
This impressive growth trajectory highlights Waste Connections, Inc.'s strategic expansion and operational efficiency. Meanwhile, Rentokil Initial plc's steady rise underscores its resilience and adaptability in a competitive market. As these companies continue to innovate and expand, they set a benchmark for excellence in their respective fields.
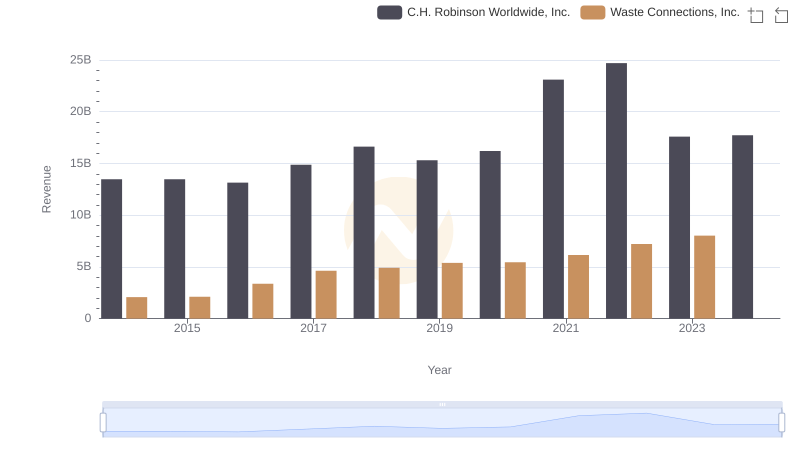
Revenue Insights: Waste Connections, Inc. and C.H. Robinson Worldwide, Inc. Performance Compared
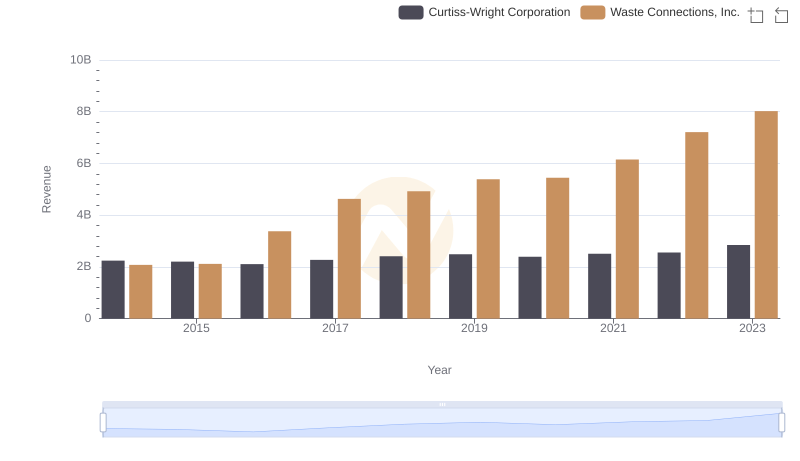
Annual Revenue Comparison: Waste Connections, Inc. vs Curtiss-Wright Corporation
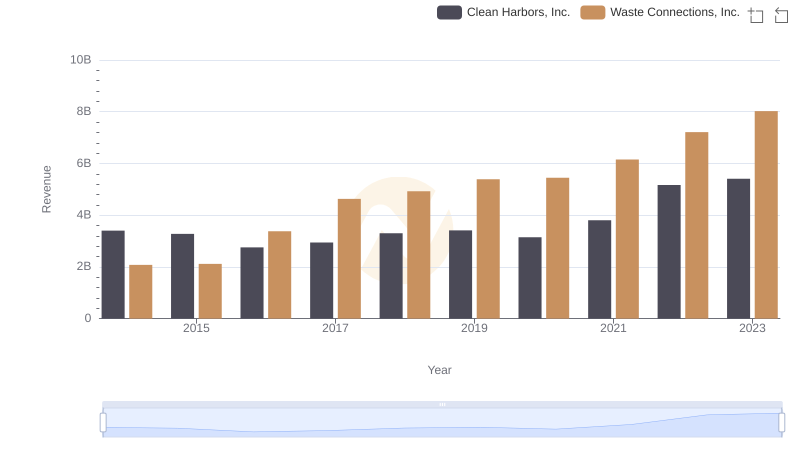
Waste Connections, Inc. or Clean Harbors, Inc.: Who Leads in Yearly Revenue?
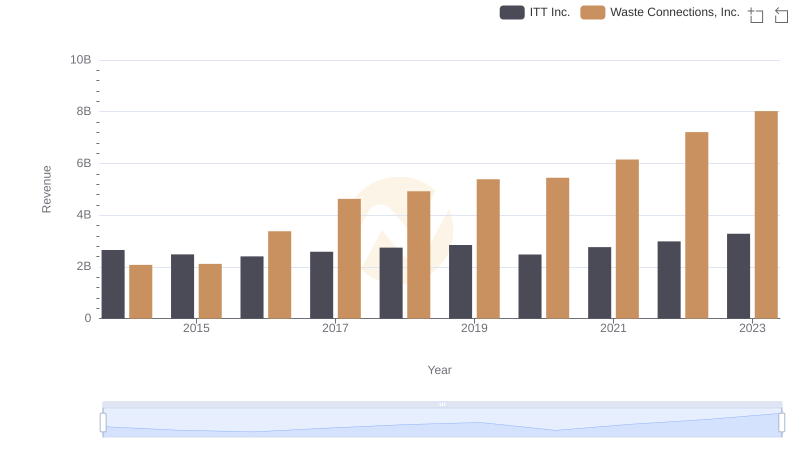
Revenue Showdown: Waste Connections, Inc. vs ITT Inc.
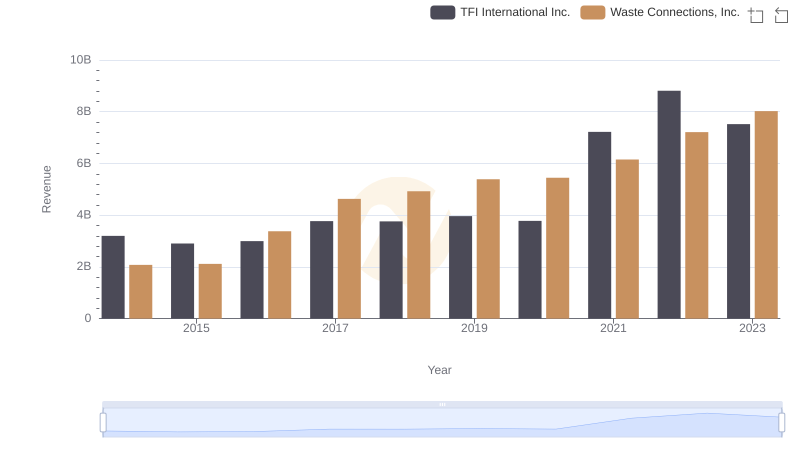
Waste Connections, Inc. or TFI International Inc.: Who Leads in Yearly Revenue?

Analyzing Cost of Revenue: Waste Connections, Inc. and Rentokil Initial plc
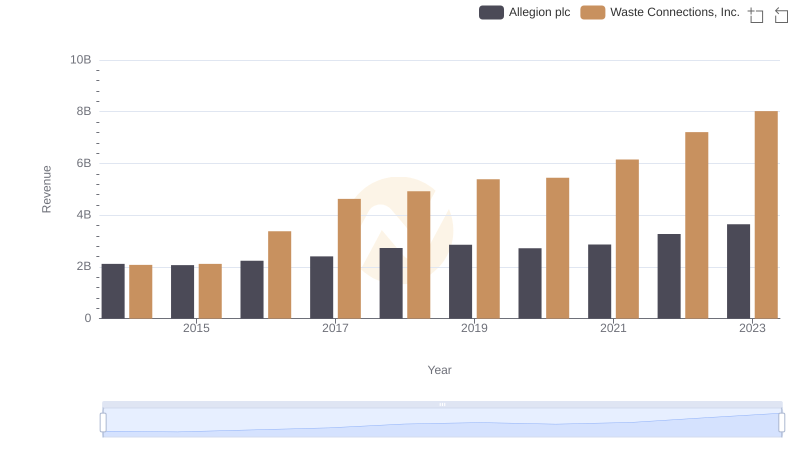
Revenue Showdown: Waste Connections, Inc. vs Allegion plc
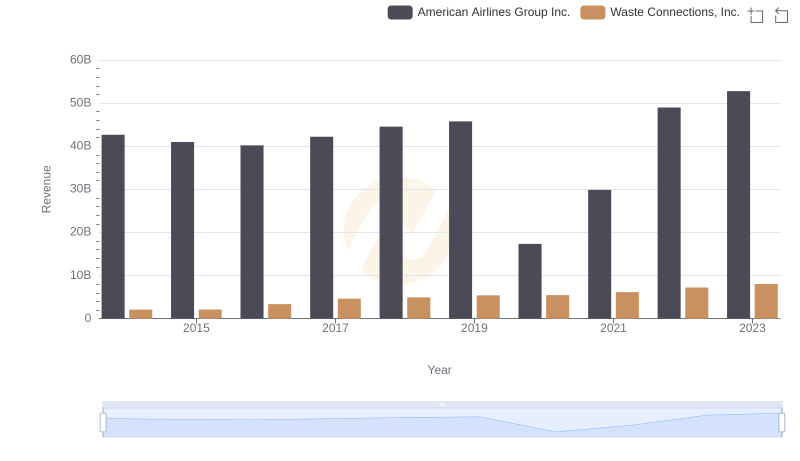
Revenue Insights: Waste Connections, Inc. and American Airlines Group Inc. Performance Compared
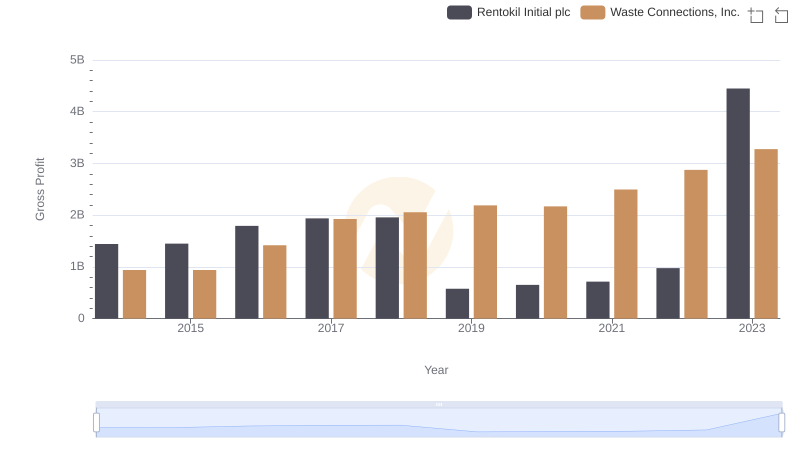
Gross Profit Analysis: Comparing Waste Connections, Inc. and Rentokil Initial plc
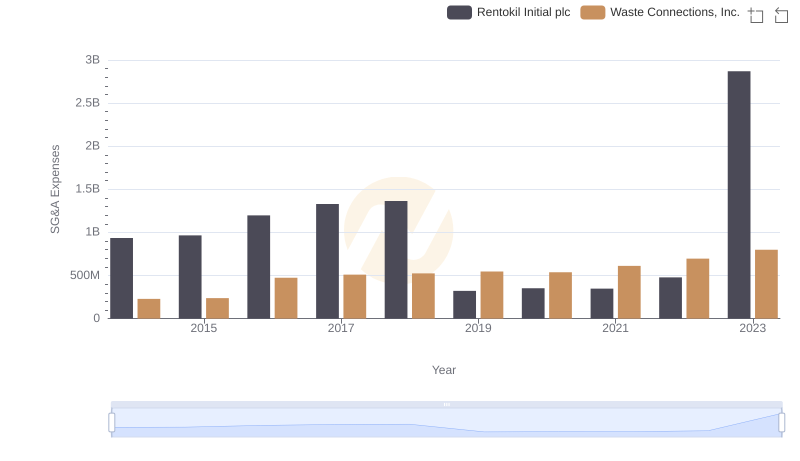
Comparing SG&A Expenses: Waste Connections, Inc. vs Rentokil Initial plc Trends and Insights

Comparative EBITDA Analysis: Waste Connections, Inc. vs Rentokil Initial plc