| __timestamp | ITT Inc. | Waste Connections, Inc. |
|---|---|---|
| Wednesday, January 1, 2014 | 1788200000 | 1138388000 |
| Thursday, January 1, 2015 | 1676500000 | 1177409000 |
| Friday, January 1, 2016 | 1647200000 | 1957712000 |
| Sunday, January 1, 2017 | 1768100000 | 2704775000 |
| Monday, January 1, 2018 | 1857900000 | 2865704000 |
| Tuesday, January 1, 2019 | 1936300000 | 3198757000 |
| Wednesday, January 1, 2020 | 1695600000 | 3276808000 |
| Friday, January 1, 2021 | 1865500000 | 3654074000 |
| Saturday, January 1, 2022 | 2065400000 | 4336012000 |
| Sunday, January 1, 2023 | 2175700000 | 4744513000 |
| Monday, January 1, 2024 | 2383400000 | 5191706000 |
Unlocking the unknown
In the ever-evolving landscape of industrial services, Waste Connections, Inc. and ITT Inc. have shown distinct trajectories in their cost of revenue from 2014 to 2023. Waste Connections, Inc. has experienced a remarkable growth, with its cost of revenue surging by over 316% from 2014 to 2023. This growth reflects the company's strategic expansions and operational efficiencies. In contrast, ITT Inc. has maintained a more stable trend, with a modest increase of approximately 22% over the same period. This stability underscores ITT Inc.'s consistent operational management and market positioning.
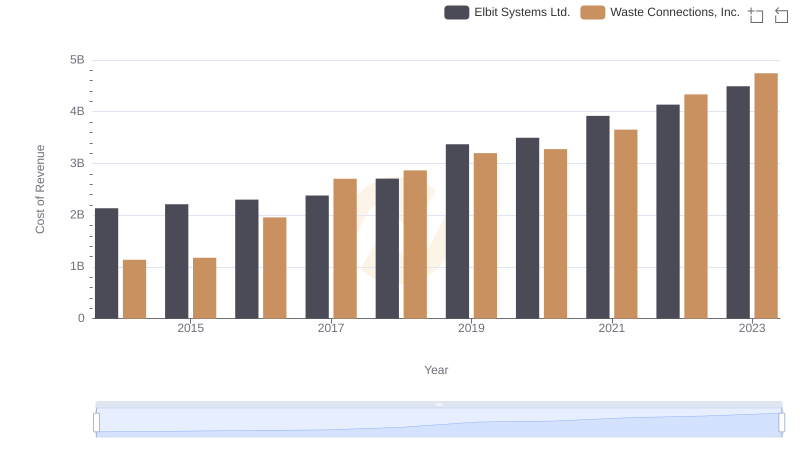
Cost of Revenue Trends: Waste Connections, Inc. vs Elbit Systems Ltd.
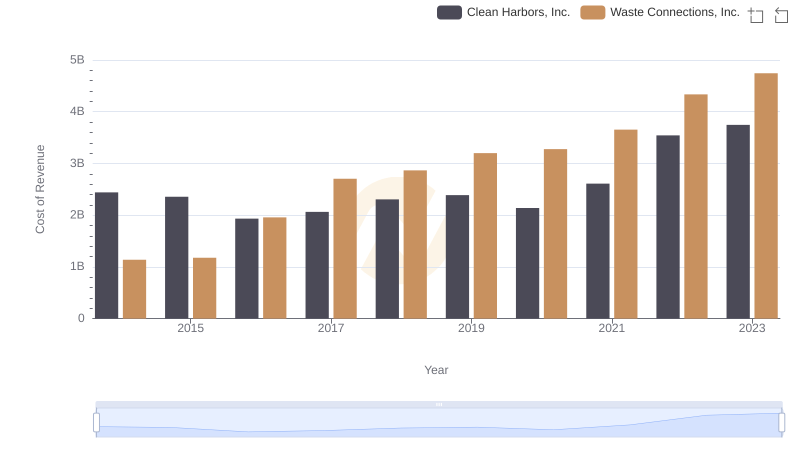
Waste Connections, Inc. vs Clean Harbors, Inc.: Efficiency in Cost of Revenue Explored
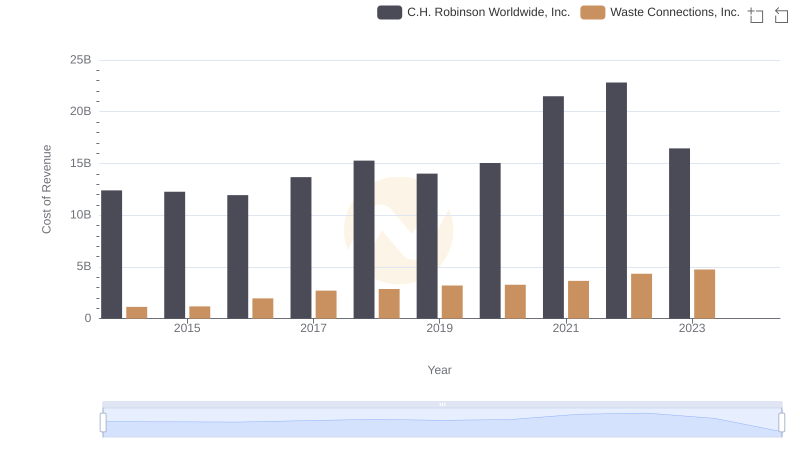
Analyzing Cost of Revenue: Waste Connections, Inc. and C.H. Robinson Worldwide, Inc.
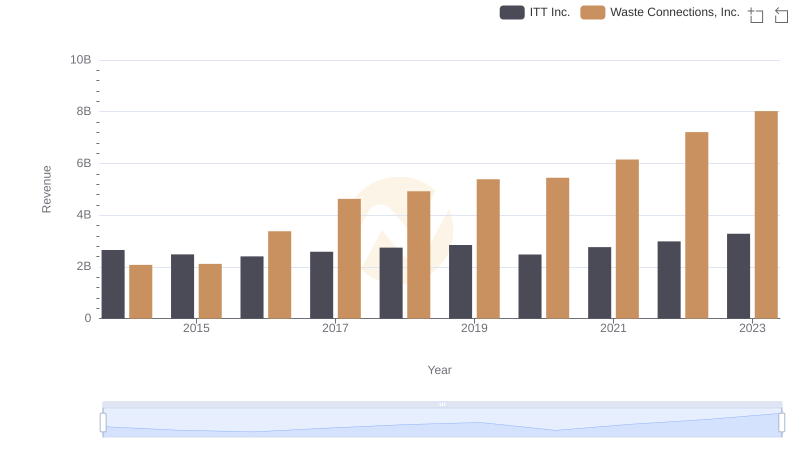
Revenue Showdown: Waste Connections, Inc. vs ITT Inc.
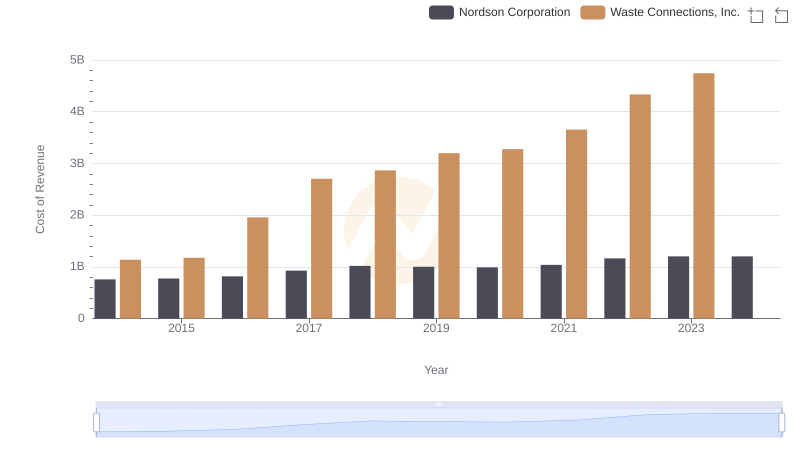
Cost of Revenue Trends: Waste Connections, Inc. vs Nordson Corporation

Analyzing Cost of Revenue: Waste Connections, Inc. and Rentokil Initial plc
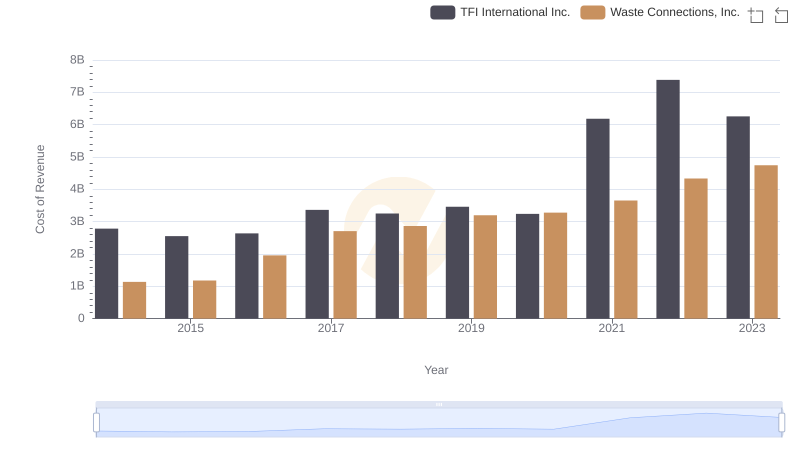
Analyzing Cost of Revenue: Waste Connections, Inc. and TFI International Inc.
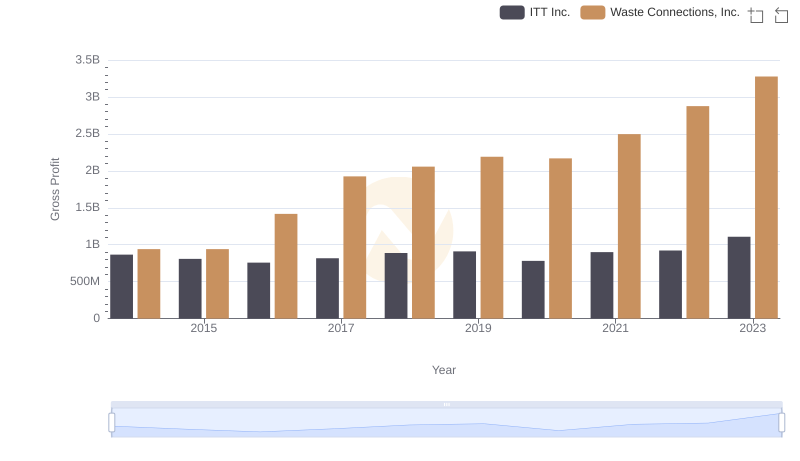
Waste Connections, Inc. vs ITT Inc.: A Gross Profit Performance Breakdown
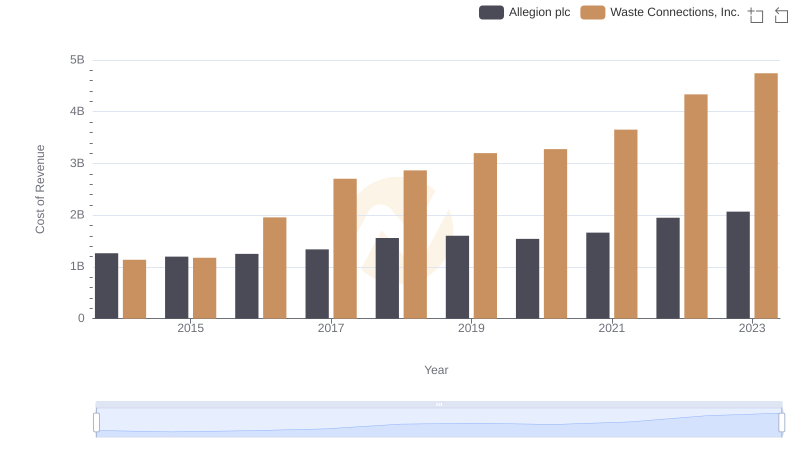
Comparing Cost of Revenue Efficiency: Waste Connections, Inc. vs Allegion plc
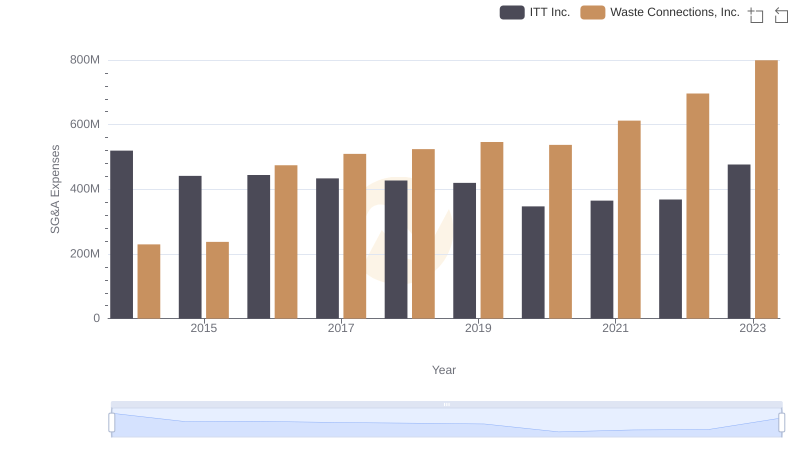
Cost Management Insights: SG&A Expenses for Waste Connections, Inc. and ITT Inc.
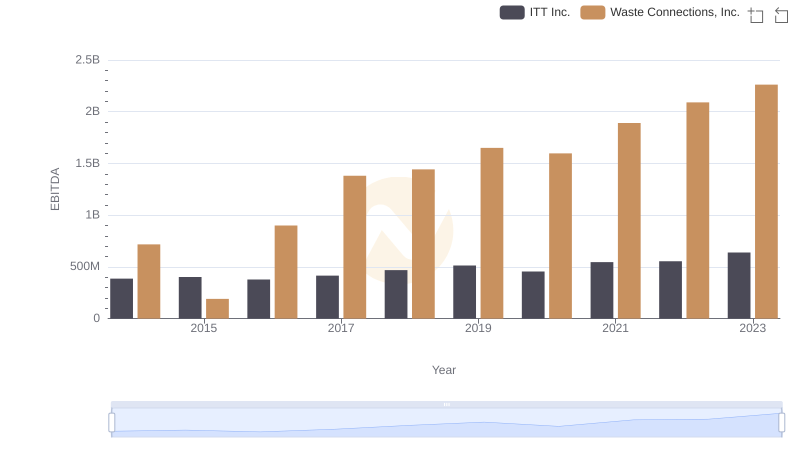
Comprehensive EBITDA Comparison: Waste Connections, Inc. vs ITT Inc.