| __timestamp | Rentokil Initial plc | Waste Connections, Inc. |
|---|---|---|
| Wednesday, January 1, 2014 | 1443300000 | 940778000 |
| Thursday, January 1, 2015 | 1448800000 | 939878000 |
| Friday, January 1, 2016 | 1792000000 | 1418151000 |
| Sunday, January 1, 2017 | 1937400000 | 1925713000 |
| Monday, January 1, 2018 | 1958100000 | 2057237000 |
| Tuesday, January 1, 2019 | 577200000 | 2189922000 |
| Wednesday, January 1, 2020 | 653000000 | 2169182000 |
| Friday, January 1, 2021 | 714800000 | 2497287000 |
| Saturday, January 1, 2022 | 977000000 | 2875847000 |
| Sunday, January 1, 2023 | 4448000000 | 3277438000 |
| Monday, January 1, 2024 | 3727885000 |
Cracking the code
In the ever-evolving landscape of global business, understanding the financial health of companies is crucial. This analysis delves into the gross profit trends of two industry giants: Waste Connections, Inc. and Rentokil Initial plc, from 2014 to 2023. Over this period, Waste Connections, Inc. has shown a consistent upward trajectory, with a remarkable 248% increase in gross profit, peaking in 2023. Meanwhile, Rentokil Initial plc experienced a significant surge in 2023, with a gross profit increase of over 350% compared to the previous year. This dramatic rise highlights Rentokil's strategic growth initiatives. The data reveals a competitive race, with Waste Connections maintaining a steady lead until Rentokil's recent leap. As these companies continue to expand, stakeholders and investors should keep a keen eye on their financial strategies and market positioning.
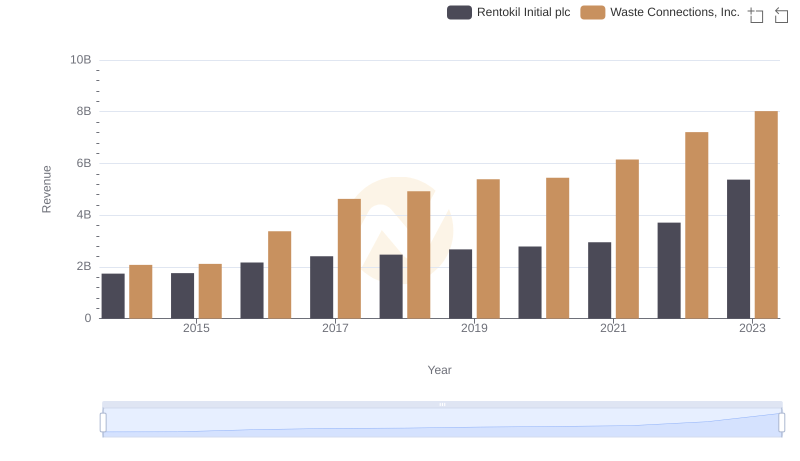
Revenue Insights: Waste Connections, Inc. and Rentokil Initial plc Performance Compared
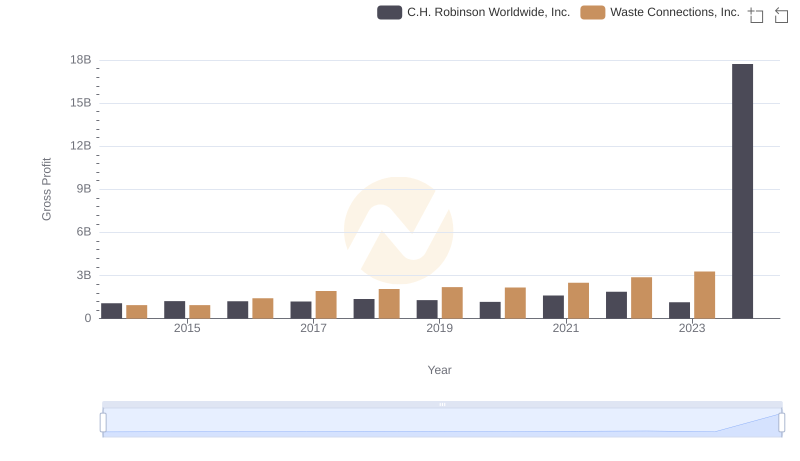
Key Insights on Gross Profit: Waste Connections, Inc. vs C.H. Robinson Worldwide, Inc.
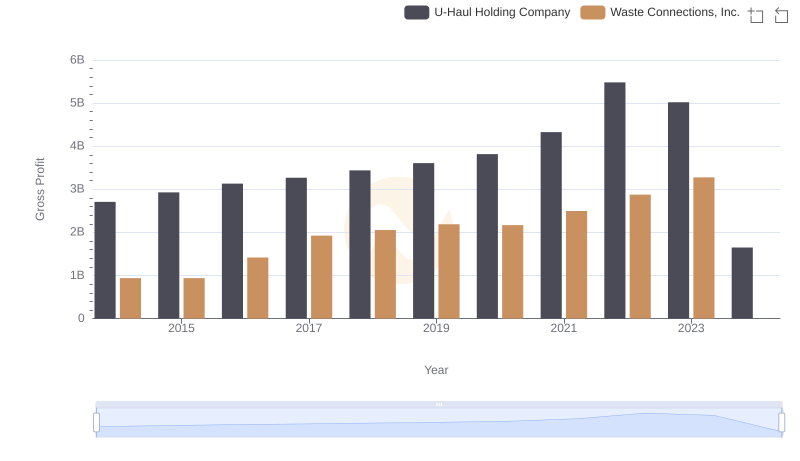
Key Insights on Gross Profit: Waste Connections, Inc. vs U-Haul Holding Company
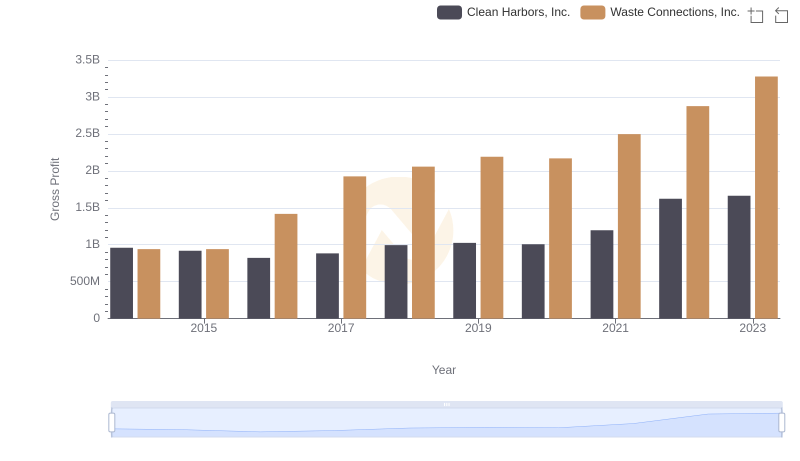
Waste Connections, Inc. and Clean Harbors, Inc.: A Detailed Gross Profit Analysis

Analyzing Cost of Revenue: Waste Connections, Inc. and Rentokil Initial plc
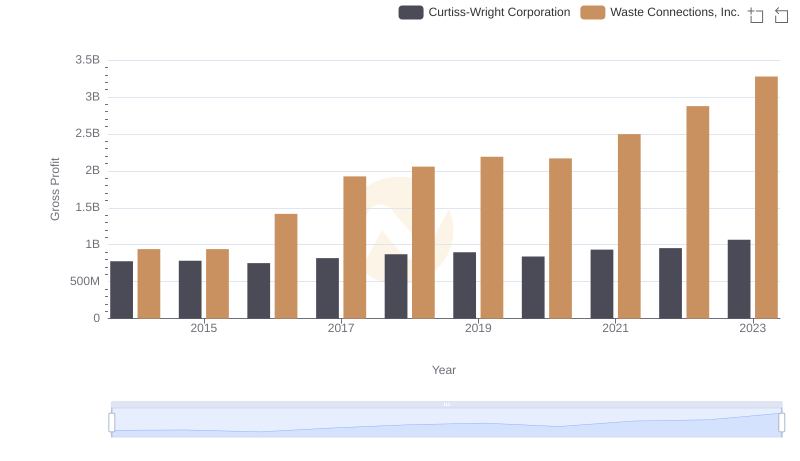
Gross Profit Trends Compared: Waste Connections, Inc. vs Curtiss-Wright Corporation
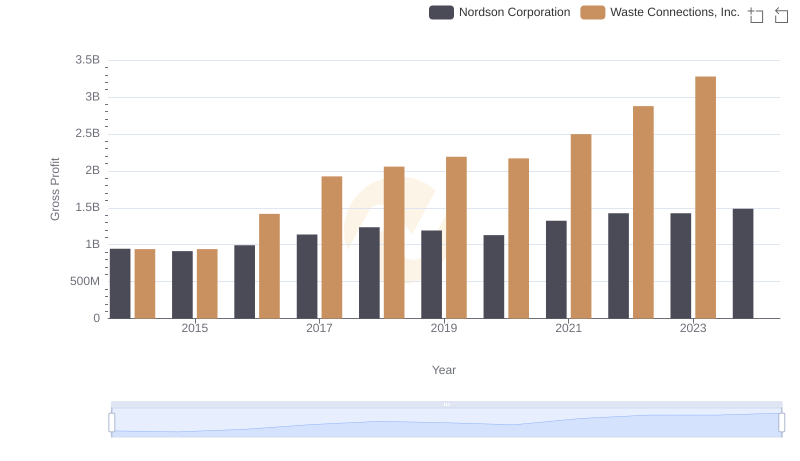
Gross Profit Comparison: Waste Connections, Inc. and Nordson Corporation Trends
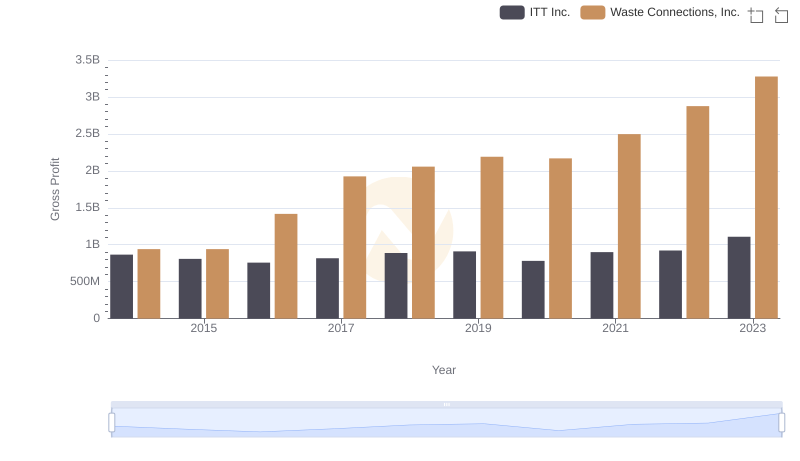
Waste Connections, Inc. vs ITT Inc.: A Gross Profit Performance Breakdown
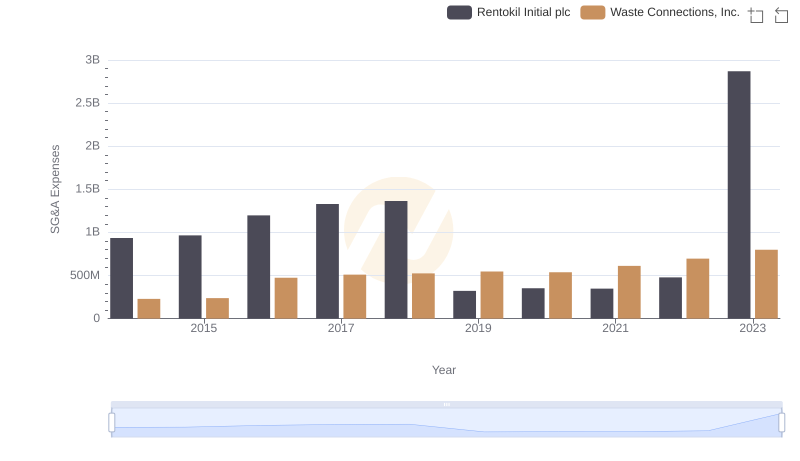
Comparing SG&A Expenses: Waste Connections, Inc. vs Rentokil Initial plc Trends and Insights

Comparative EBITDA Analysis: Waste Connections, Inc. vs Rentokil Initial plc