| __timestamp | Clean Harbors, Inc. | Waste Connections, Inc. |
|---|---|---|
| Wednesday, January 1, 2014 | 2441796000 | 1138388000 |
| Thursday, January 1, 2015 | 2356806000 | 1177409000 |
| Friday, January 1, 2016 | 1932857000 | 1957712000 |
| Sunday, January 1, 2017 | 2062673000 | 2704775000 |
| Monday, January 1, 2018 | 2305551000 | 2865704000 |
| Tuesday, January 1, 2019 | 2387819000 | 3198757000 |
| Wednesday, January 1, 2020 | 2137751000 | 3276808000 |
| Friday, January 1, 2021 | 2609837000 | 3654074000 |
| Saturday, January 1, 2022 | 3543930000 | 4336012000 |
| Sunday, January 1, 2023 | 3746124000 | 4744513000 |
| Monday, January 1, 2024 | 4065713000 | 5191706000 |
Unleashing insights
In the competitive landscape of waste management, efficiency in cost of revenue is paramount. Over the past decade, Waste Connections, Inc. and Clean Harbors, Inc. have demonstrated contrasting trajectories in this regard. From 2014 to 2023, Waste Connections, Inc. has seen a remarkable increase in its cost of revenue, growing by approximately 316%, from $1.14 billion to $4.74 billion. In contrast, Clean Harbors, Inc. experienced a more modest growth of around 53%, from $2.44 billion to $3.75 billion.
This data highlights Waste Connections, Inc.'s aggressive expansion strategy, potentially driven by acquisitions and scaling operations. Meanwhile, Clean Harbors, Inc. appears to maintain a steadier, more controlled growth. As the industry evolves, these trends offer valuable insights into the strategic priorities and operational efficiencies of these two major players.
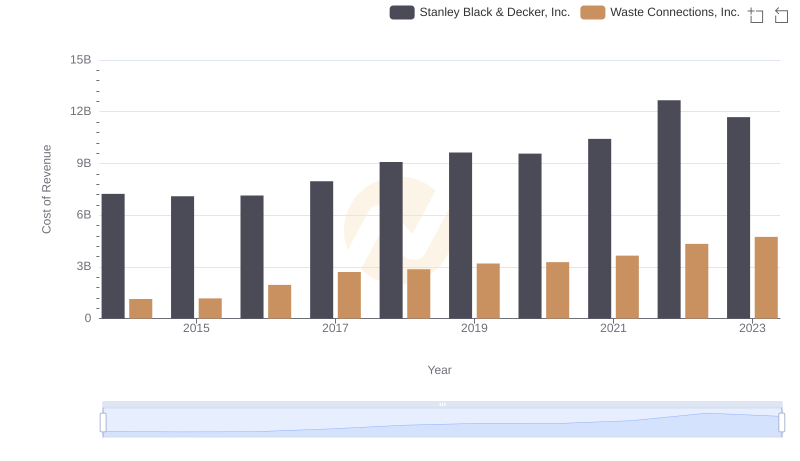
Cost Insights: Breaking Down Waste Connections, Inc. and Stanley Black & Decker, Inc.'s Expenses
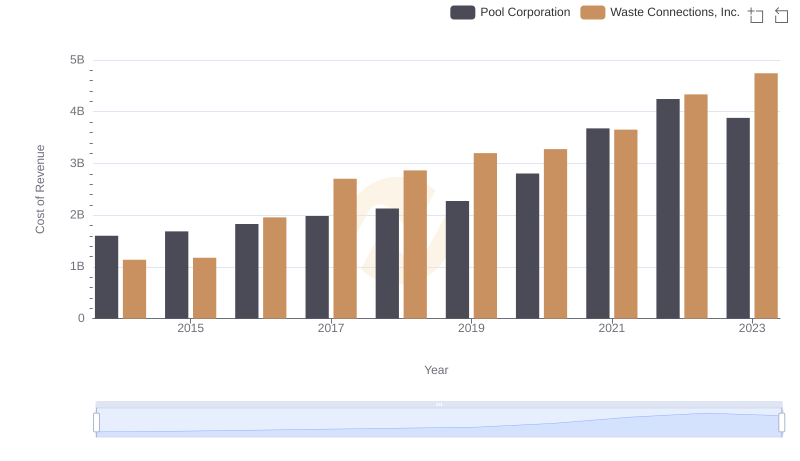
Waste Connections, Inc. vs Pool Corporation: Efficiency in Cost of Revenue Explored
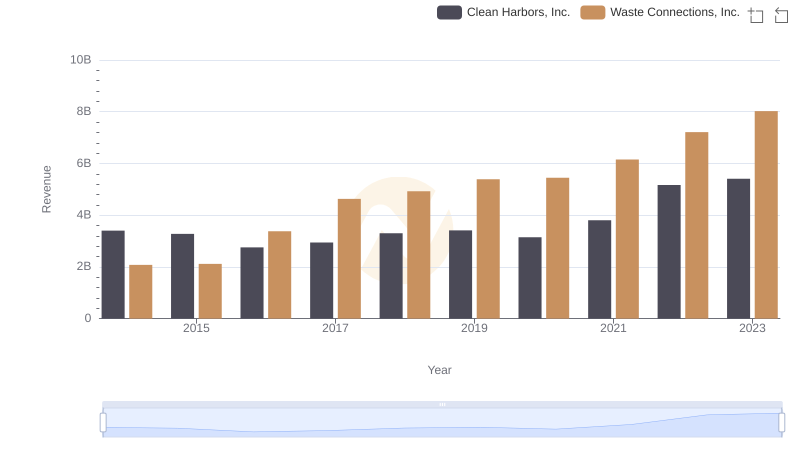
Waste Connections, Inc. or Clean Harbors, Inc.: Who Leads in Yearly Revenue?
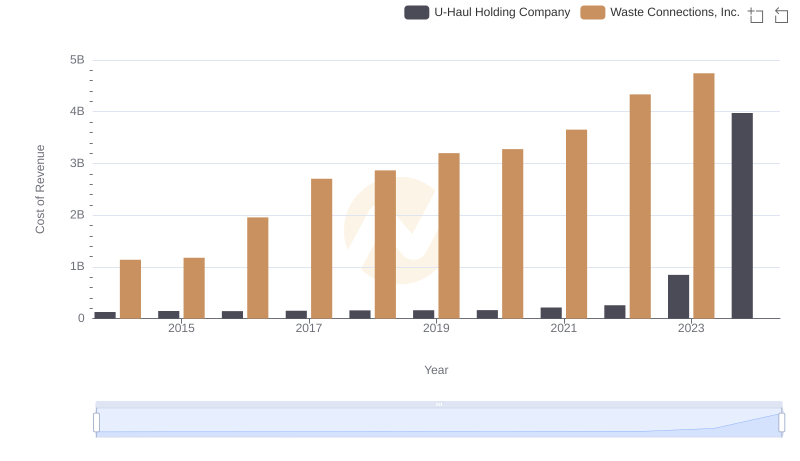
Cost of Revenue Trends: Waste Connections, Inc. vs U-Haul Holding Company
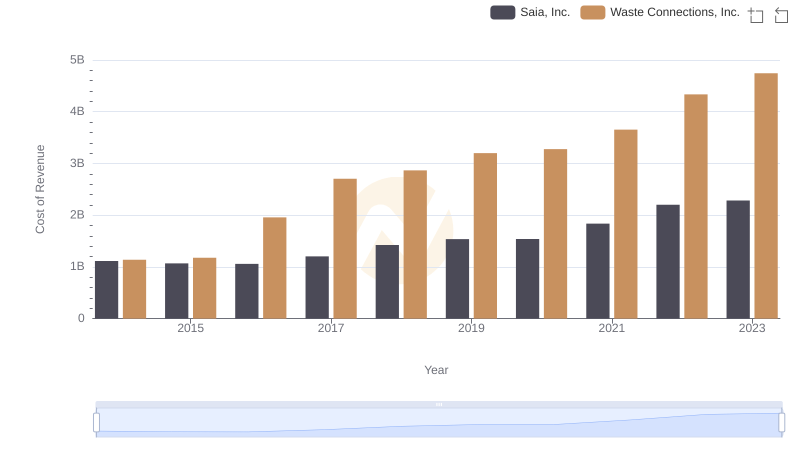
Cost Insights: Breaking Down Waste Connections, Inc. and Saia, Inc.'s Expenses
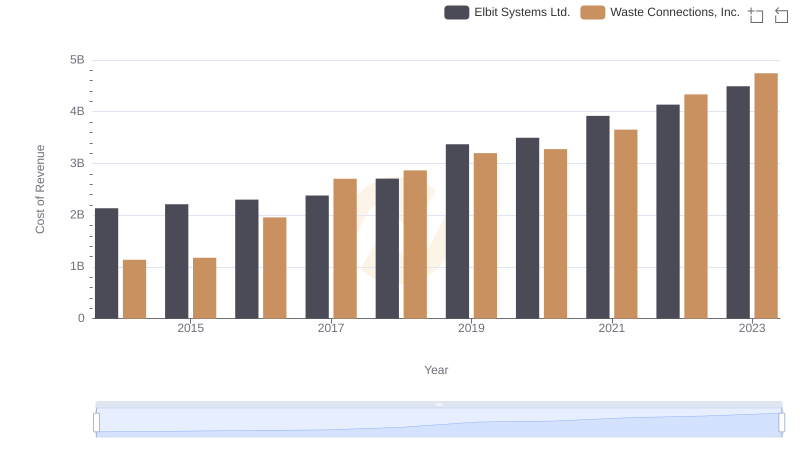
Cost of Revenue Trends: Waste Connections, Inc. vs Elbit Systems Ltd.
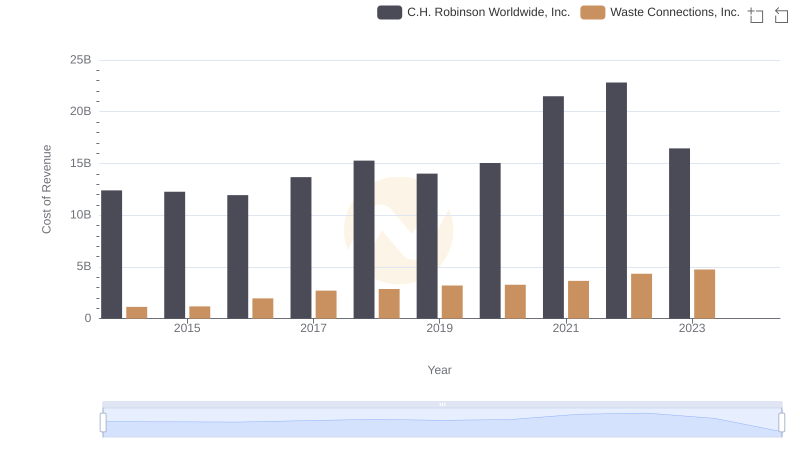
Analyzing Cost of Revenue: Waste Connections, Inc. and C.H. Robinson Worldwide, Inc.
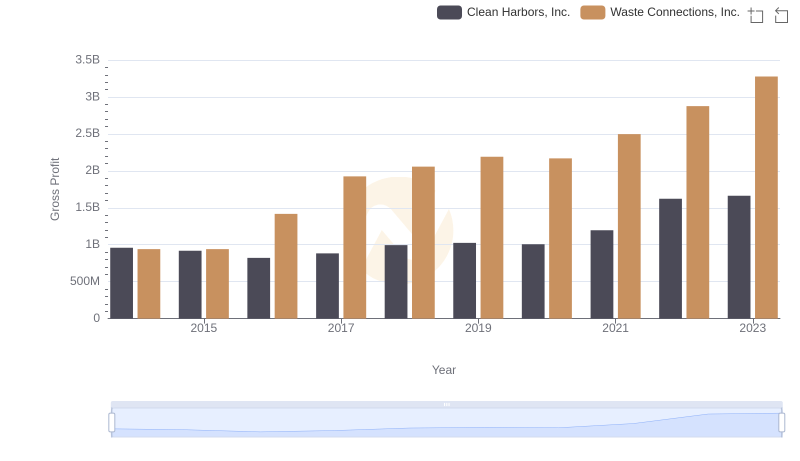
Waste Connections, Inc. and Clean Harbors, Inc.: A Detailed Gross Profit Analysis
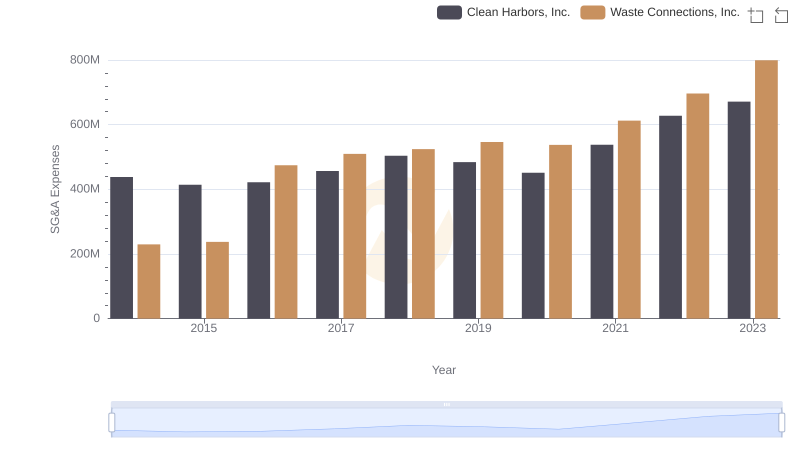
Selling, General, and Administrative Costs: Waste Connections, Inc. vs Clean Harbors, Inc.