| __timestamp | Nordson Corporation | Waste Connections, Inc. |
|---|---|---|
| Wednesday, January 1, 2014 | 758923000 | 1138388000 |
| Thursday, January 1, 2015 | 774702000 | 1177409000 |
| Friday, January 1, 2016 | 815495000 | 1957712000 |
| Sunday, January 1, 2017 | 927981000 | 2704775000 |
| Monday, January 1, 2018 | 1018703000 | 2865704000 |
| Tuesday, January 1, 2019 | 1002123000 | 3198757000 |
| Wednesday, January 1, 2020 | 990632000 | 3276808000 |
| Friday, January 1, 2021 | 1038129000 | 3654074000 |
| Saturday, January 1, 2022 | 1163742000 | 4336012000 |
| Sunday, January 1, 2023 | 1203227000 | 4744513000 |
| Monday, January 1, 2024 | 1203792000 | 5191706000 |
In pursuit of knowledge
In the ever-evolving landscape of industrial giants, Waste Connections, Inc. and Nordson Corporation have carved distinct paths in managing their cost of revenue. Over the past decade, from 2014 to 2023, Waste Connections, Inc. has seen a staggering increase of over 316% in its cost of revenue, peaking at approximately $4.74 billion in 2023. This reflects the company's aggressive expansion and operational scaling. In contrast, Nordson Corporation has experienced a more modest growth of around 58% during the same period, reaching about $1.20 billion in 2023. This steady rise underscores Nordson's strategic focus on efficiency and innovation. Notably, data for Waste Connections, Inc. in 2024 is missing, leaving room for speculation on future trends. As these companies continue to navigate the complexities of their industries, their cost management strategies will remain pivotal in shaping their financial narratives.
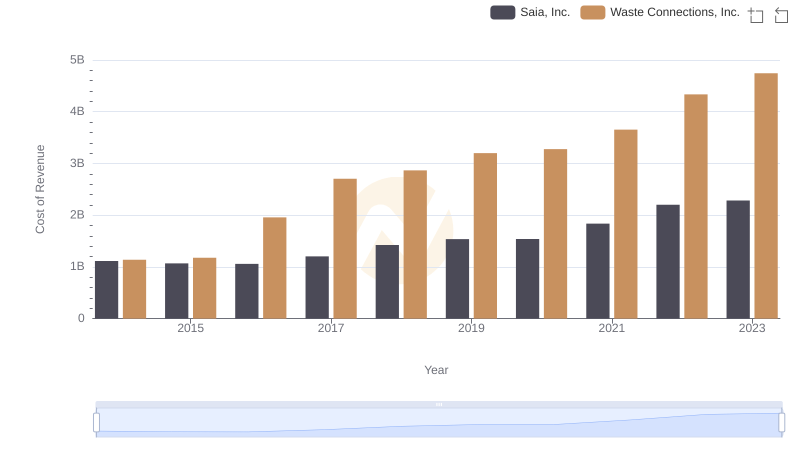
Cost Insights: Breaking Down Waste Connections, Inc. and Saia, Inc.'s Expenses
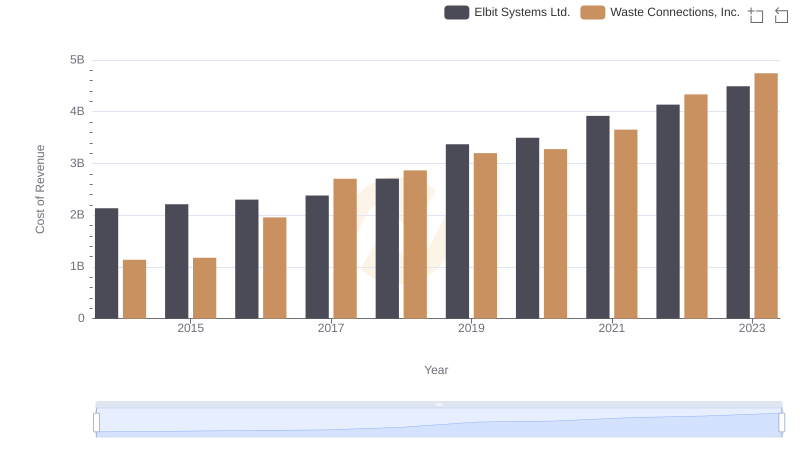
Cost of Revenue Trends: Waste Connections, Inc. vs Elbit Systems Ltd.
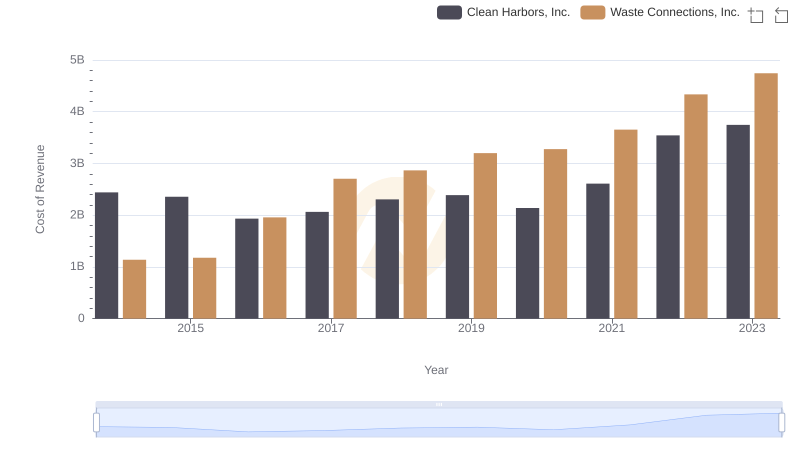
Waste Connections, Inc. vs Clean Harbors, Inc.: Efficiency in Cost of Revenue Explored
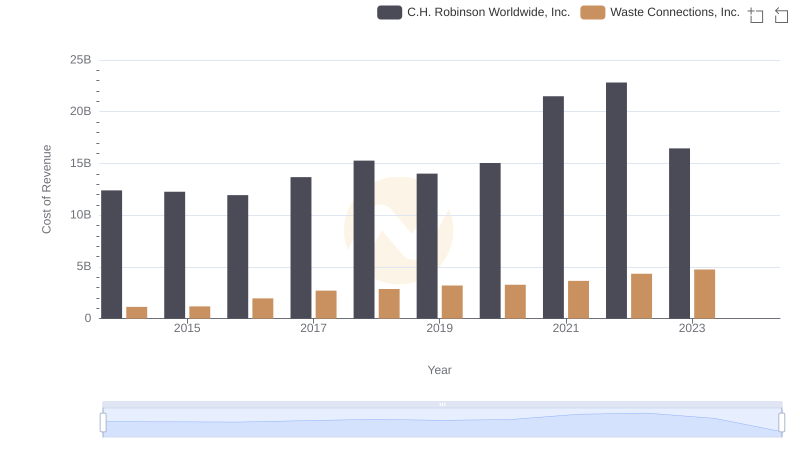
Analyzing Cost of Revenue: Waste Connections, Inc. and C.H. Robinson Worldwide, Inc.
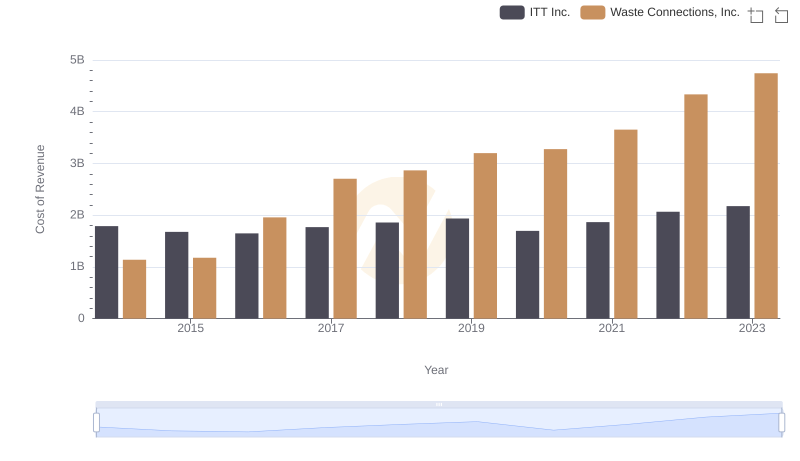
Cost of Revenue Trends: Waste Connections, Inc. vs ITT Inc.

Analyzing Cost of Revenue: Waste Connections, Inc. and Rentokil Initial plc
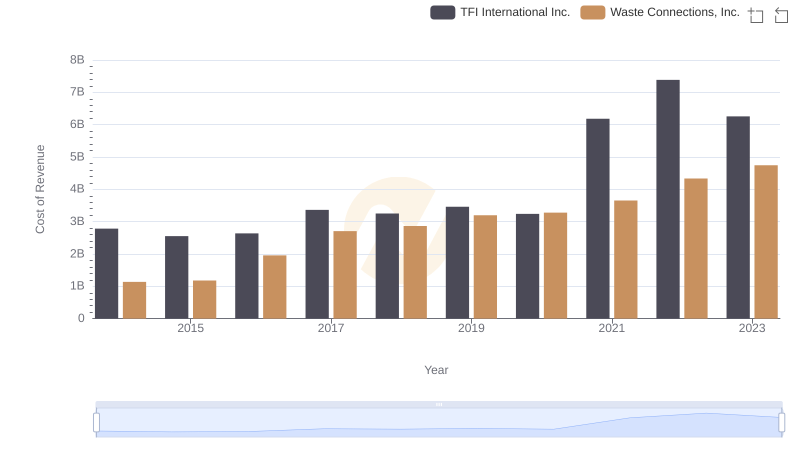
Analyzing Cost of Revenue: Waste Connections, Inc. and TFI International Inc.
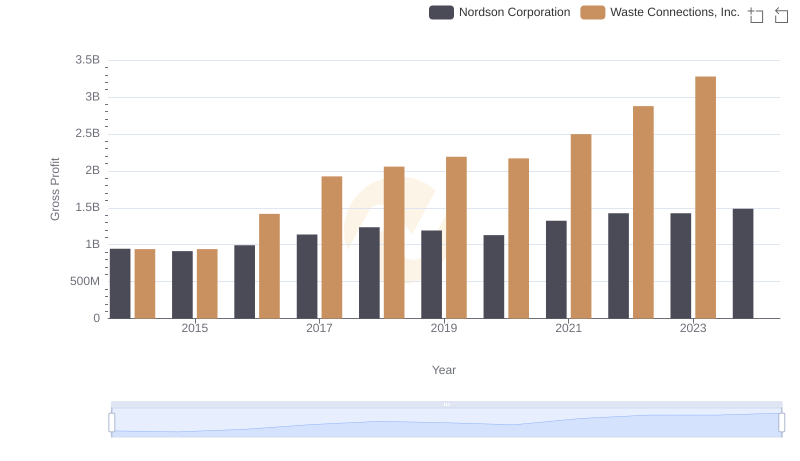
Gross Profit Comparison: Waste Connections, Inc. and Nordson Corporation Trends

Comprehensive EBITDA Comparison: Waste Connections, Inc. vs Nordson Corporation