| __timestamp | TFI International Inc. | Waste Connections, Inc. |
|---|---|---|
| Wednesday, January 1, 2014 | 2782605137 | 1138388000 |
| Thursday, January 1, 2015 | 2551474032 | 1177409000 |
| Friday, January 1, 2016 | 2636493564 | 1957712000 |
| Sunday, January 1, 2017 | 3364979721 | 2704775000 |
| Monday, January 1, 2018 | 3251443800 | 2865704000 |
| Tuesday, January 1, 2019 | 3461987950 | 3198757000 |
| Wednesday, January 1, 2020 | 3239249000 | 3276808000 |
| Friday, January 1, 2021 | 6182566000 | 3654074000 |
| Saturday, January 1, 2022 | 7385640000 | 4336012000 |
| Sunday, January 1, 2023 | 6255775000 | 4744513000 |
| Monday, January 1, 2024 | 5191706000 |
Cracking the code
In the ever-evolving landscape of North American logistics and waste management, TFI International Inc. and Waste Connections, Inc. stand as titans. Over the past decade, these companies have demonstrated remarkable growth in their cost of revenue, a key indicator of operational scale and efficiency. From 2014 to 2023, TFI International's cost of revenue surged by approximately 168%, peaking in 2022. Meanwhile, Waste Connections saw a steady increase of around 317% over the same period, reflecting its expanding footprint in the waste management sector.
The year 2021 marked a significant leap for TFI International, with a 91% increase from the previous year, likely driven by strategic acquisitions and market expansion. Waste Connections, on the other hand, maintained a consistent upward trajectory, culminating in a 9% rise in 2023. These trends underscore the dynamic nature of these industries and the strategic maneuvers of these companies.
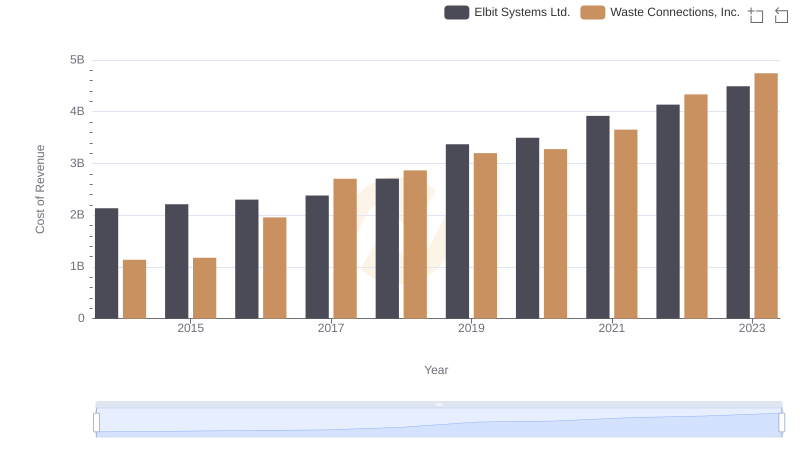
Cost of Revenue Trends: Waste Connections, Inc. vs Elbit Systems Ltd.
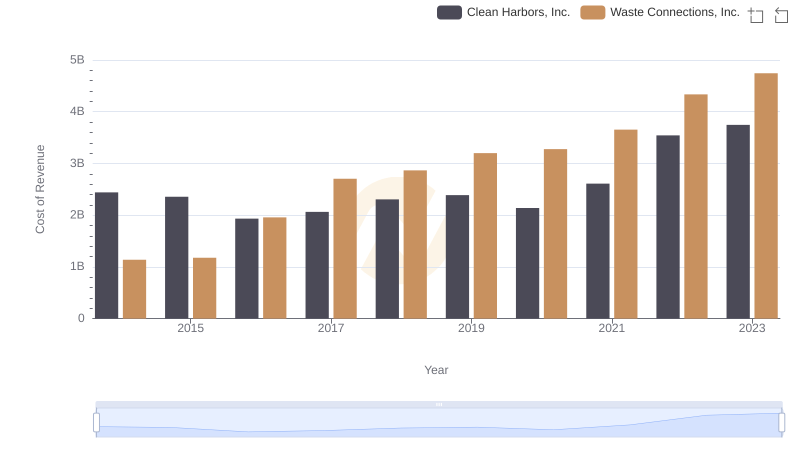
Waste Connections, Inc. vs Clean Harbors, Inc.: Efficiency in Cost of Revenue Explored
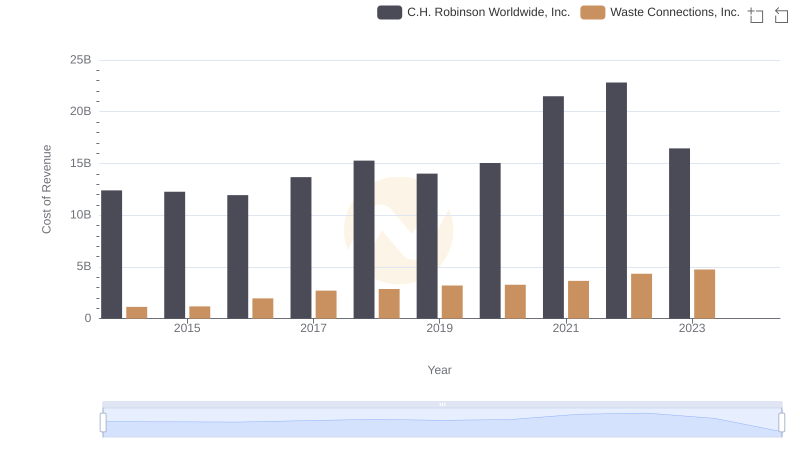
Analyzing Cost of Revenue: Waste Connections, Inc. and C.H. Robinson Worldwide, Inc.
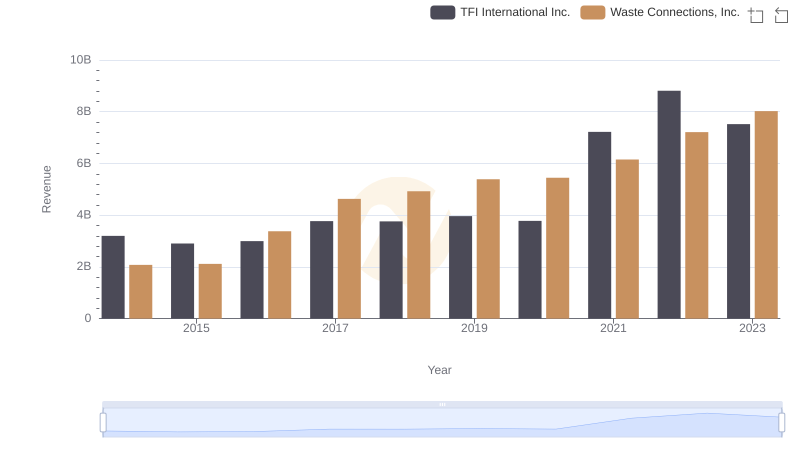
Waste Connections, Inc. or TFI International Inc.: Who Leads in Yearly Revenue?
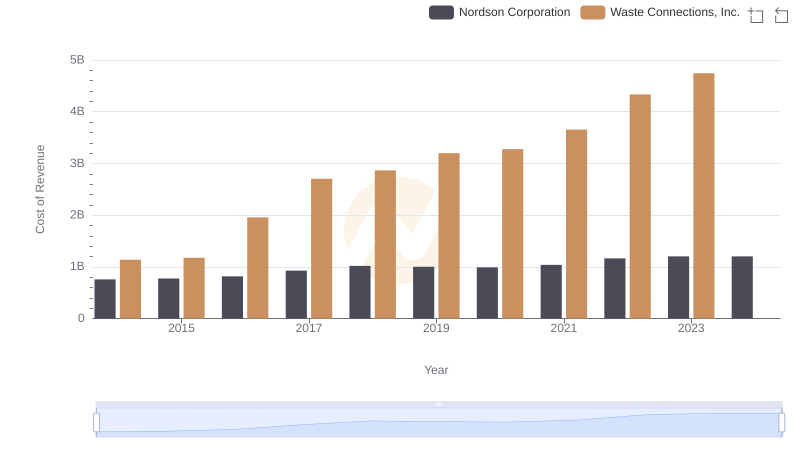
Cost of Revenue Trends: Waste Connections, Inc. vs Nordson Corporation
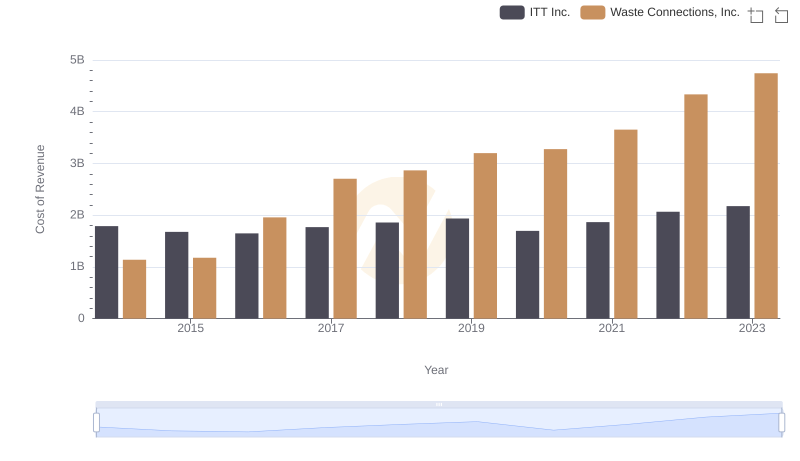
Cost of Revenue Trends: Waste Connections, Inc. vs ITT Inc.

Analyzing Cost of Revenue: Waste Connections, Inc. and Rentokil Initial plc
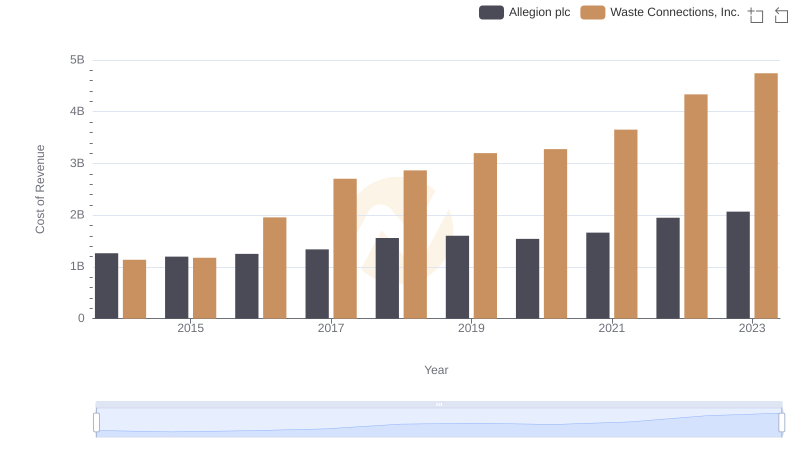
Comparing Cost of Revenue Efficiency: Waste Connections, Inc. vs Allegion plc