| __timestamp | Allegion plc | Waste Connections, Inc. |
|---|---|---|
| Wednesday, January 1, 2014 | 1264600000 | 1138388000 |
| Thursday, January 1, 2015 | 1199000000 | 1177409000 |
| Friday, January 1, 2016 | 1252700000 | 1957712000 |
| Sunday, January 1, 2017 | 1337500000 | 2704775000 |
| Monday, January 1, 2018 | 1558400000 | 2865704000 |
| Tuesday, January 1, 2019 | 1601700000 | 3198757000 |
| Wednesday, January 1, 2020 | 1541100000 | 3276808000 |
| Friday, January 1, 2021 | 1662500000 | 3654074000 |
| Saturday, January 1, 2022 | 1949500000 | 4336012000 |
| Sunday, January 1, 2023 | 2069300000 | 4744513000 |
| Monday, January 1, 2024 | 2103700000 | 5191706000 |
Cracking the code
In the ever-evolving landscape of corporate finance, understanding cost efficiency is paramount. Over the past decade, Waste Connections, Inc. and Allegion plc have demonstrated distinct trajectories in their cost of revenue efficiency. Waste Connections, Inc. has seen a remarkable increase, with their cost of revenue growing by over 300% from 2014 to 2023. This growth reflects their strategic expansions and operational scaling.
Conversely, Allegion plc has maintained a more stable trajectory, with a 70% increase over the same period. This steadiness suggests a focus on maintaining operational efficiency while expanding their market reach. By 2023, Waste Connections, Inc.'s cost of revenue was more than double that of Allegion plc, highlighting their aggressive growth strategy.
These insights provide a window into how different strategies impact financial outcomes, offering valuable lessons for investors and industry analysts alike.
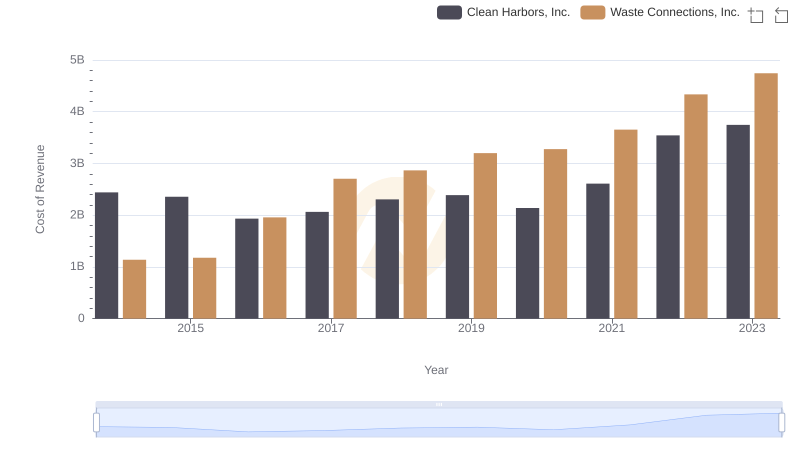
Waste Connections, Inc. vs Clean Harbors, Inc.: Efficiency in Cost of Revenue Explored
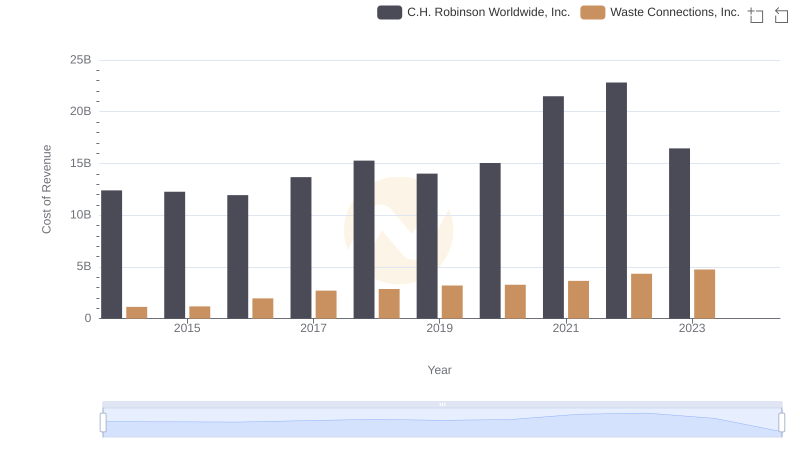
Analyzing Cost of Revenue: Waste Connections, Inc. and C.H. Robinson Worldwide, Inc.
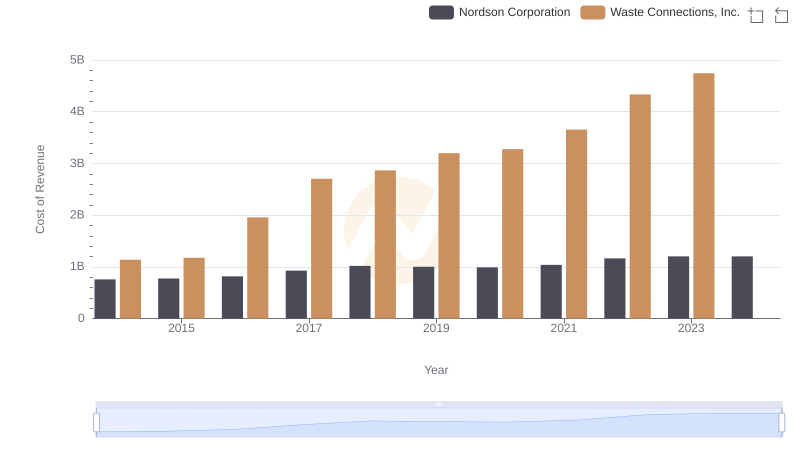
Cost of Revenue Trends: Waste Connections, Inc. vs Nordson Corporation
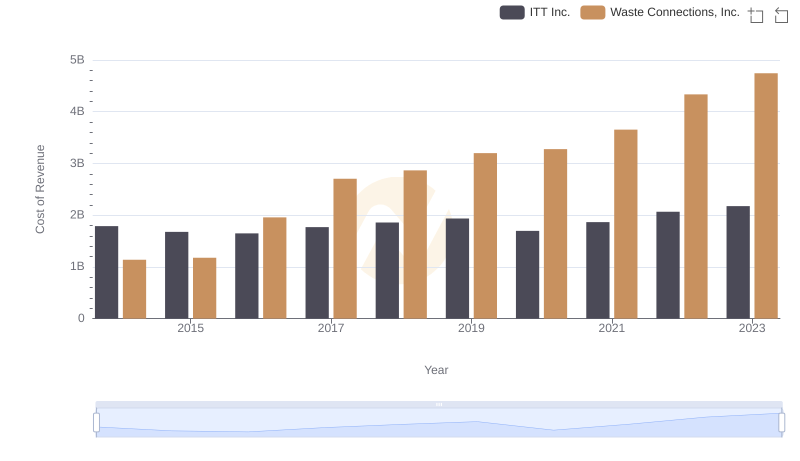
Cost of Revenue Trends: Waste Connections, Inc. vs ITT Inc.

Analyzing Cost of Revenue: Waste Connections, Inc. and Rentokil Initial plc
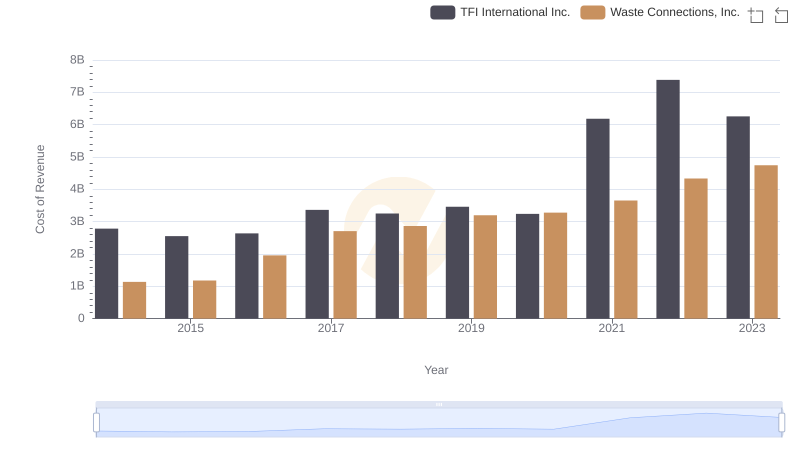
Analyzing Cost of Revenue: Waste Connections, Inc. and TFI International Inc.
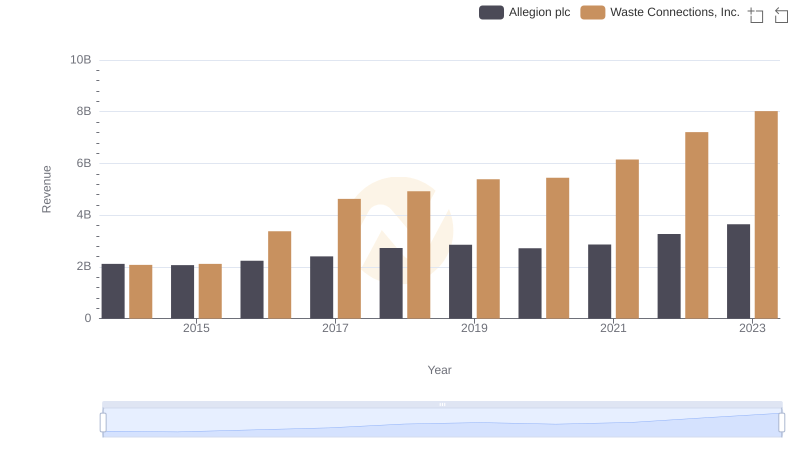
Revenue Showdown: Waste Connections, Inc. vs Allegion plc
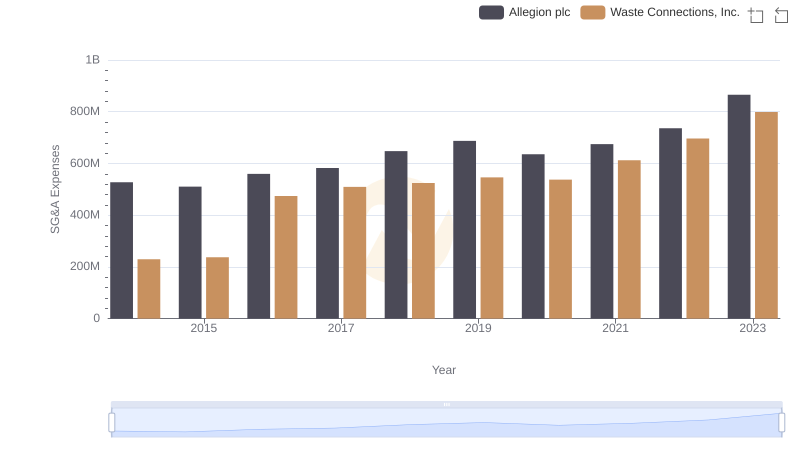
Waste Connections, Inc. or Allegion plc: Who Manages SG&A Costs Better?
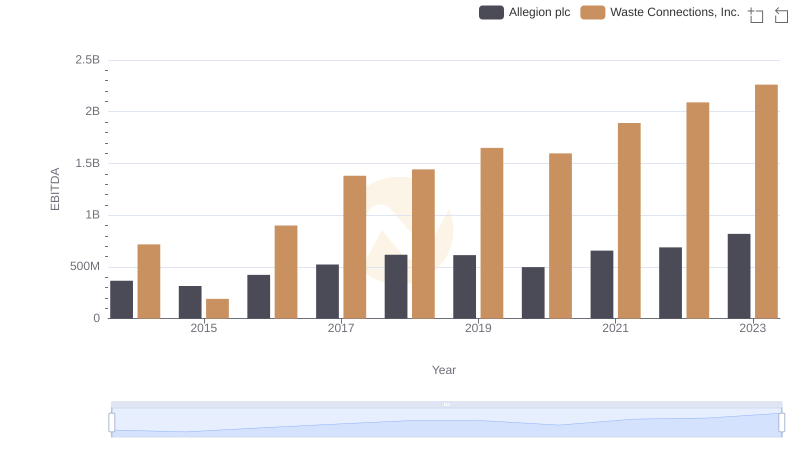
A Side-by-Side Analysis of EBITDA: Waste Connections, Inc. and Allegion plc