| __timestamp | Rentokil Initial plc | Waste Connections, Inc. |
|---|---|---|
| Wednesday, January 1, 2014 | 935700000 | 229474000 |
| Thursday, January 1, 2015 | 965700000 | 237484000 |
| Friday, January 1, 2016 | 1197600000 | 474263000 |
| Sunday, January 1, 2017 | 1329600000 | 509638000 |
| Monday, January 1, 2018 | 1364000000 | 524388000 |
| Tuesday, January 1, 2019 | 322500000 | 546278000 |
| Wednesday, January 1, 2020 | 352000000 | 537632000 |
| Friday, January 1, 2021 | 348600000 | 612337000 |
| Saturday, January 1, 2022 | 479000000 | 696467000 |
| Sunday, January 1, 2023 | 2870000000 | 799119000 |
| Monday, January 1, 2024 | 883445000 |
Cracking the code
In the competitive landscape of waste management and services, Waste Connections, Inc. and Rentokil Initial plc have shown distinct trends in their Selling, General, and Administrative (SG&A) expenses over the past decade. From 2014 to 2023, Rentokil Initial plc's SG&A expenses surged by approximately 207%, peaking in 2023. This significant increase reflects strategic investments and expansion efforts. In contrast, Waste Connections, Inc. exhibited a more stable growth pattern, with a 248% rise over the same period, indicating efficient cost management and steady business growth.
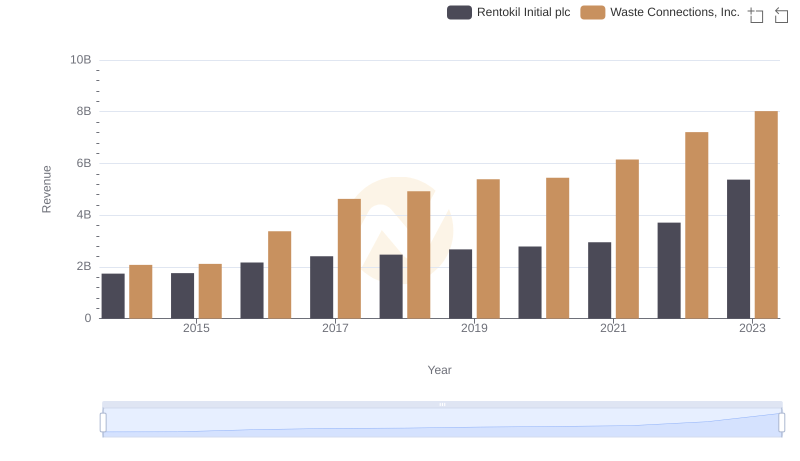
Revenue Insights: Waste Connections, Inc. and Rentokil Initial plc Performance Compared

Analyzing Cost of Revenue: Waste Connections, Inc. and Rentokil Initial plc
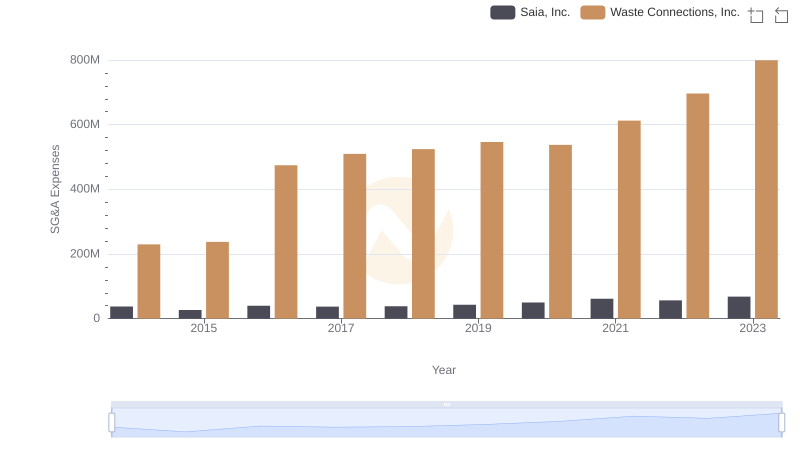
SG&A Efficiency Analysis: Comparing Waste Connections, Inc. and Saia, Inc.
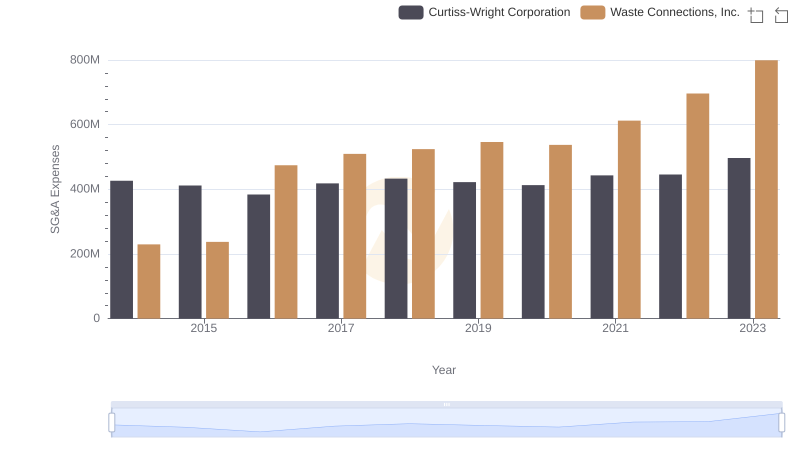
Waste Connections, Inc. vs Curtiss-Wright Corporation: SG&A Expense Trends
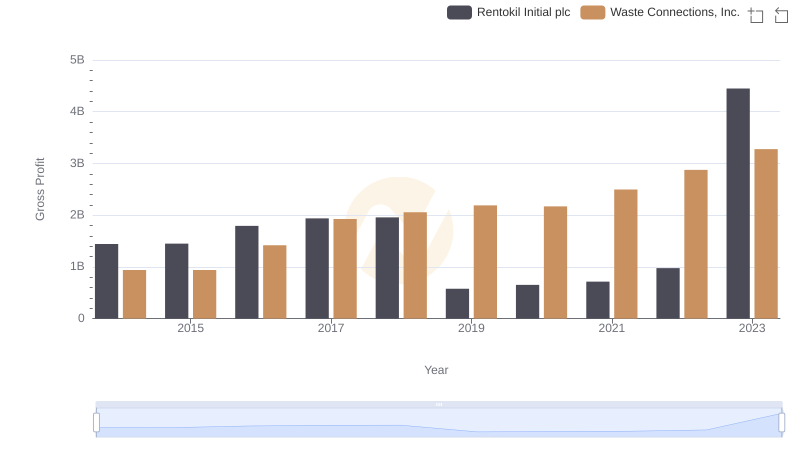
Gross Profit Analysis: Comparing Waste Connections, Inc. and Rentokil Initial plc
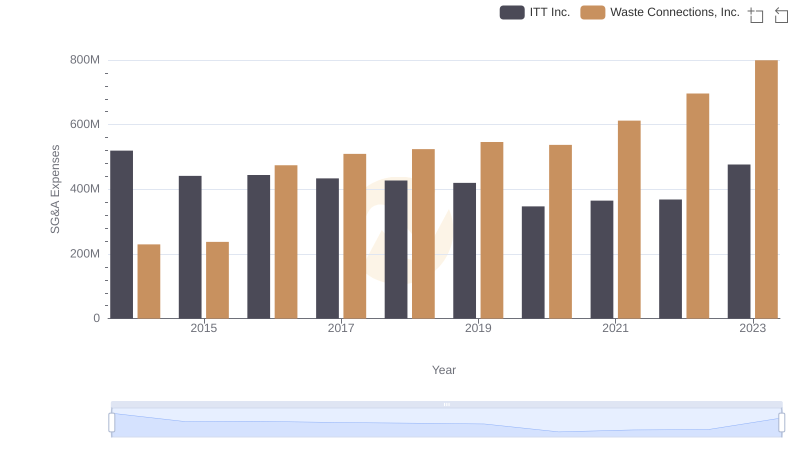
Cost Management Insights: SG&A Expenses for Waste Connections, Inc. and ITT Inc.
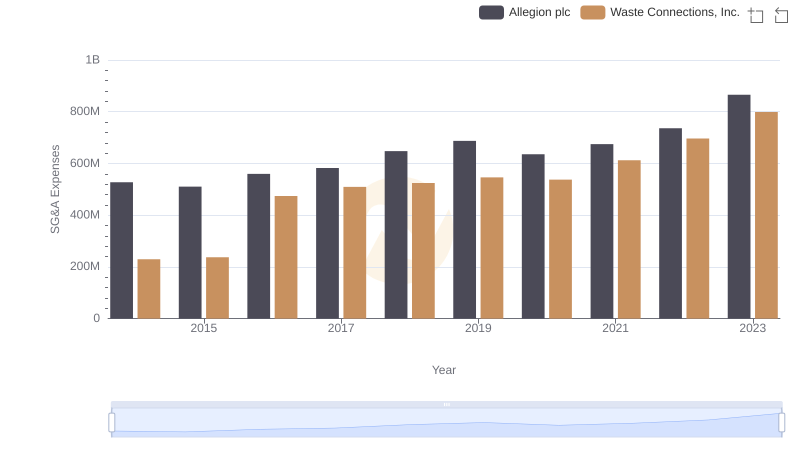
Waste Connections, Inc. or Allegion plc: Who Manages SG&A Costs Better?
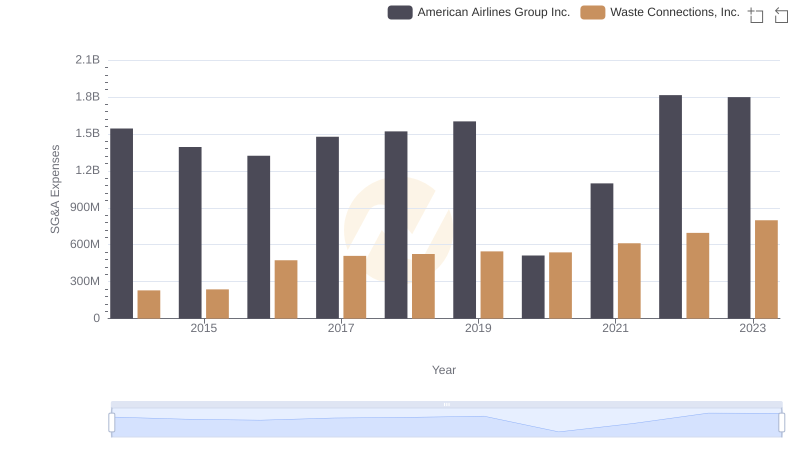
SG&A Efficiency Analysis: Comparing Waste Connections, Inc. and American Airlines Group Inc.

Comparative EBITDA Analysis: Waste Connections, Inc. vs Rentokil Initial plc