| __timestamp | Rentokil Initial plc | Waste Connections, Inc. |
|---|---|---|
| Wednesday, January 1, 2014 | 410400000 | 717805000 |
| Thursday, January 1, 2015 | 408700000 | 191002871 |
| Friday, January 1, 2016 | 489000000 | 900371894 |
| Sunday, January 1, 2017 | 503200000 | 1380632000 |
| Monday, January 1, 2018 | 149800000 | 1442229014 |
| Tuesday, January 1, 2019 | 580600000 | 1650754605 |
| Wednesday, January 1, 2020 | 581000000 | 1597555000 |
| Friday, January 1, 2021 | 656000000 | 1891001000 |
| Saturday, January 1, 2022 | 767000000 | 2090554149 |
| Sunday, January 1, 2023 | 1157000000 | 2261354000 |
| Monday, January 1, 2024 | 2389779000 |
Unleashing the power of data
In the competitive landscape of waste management and services, Waste Connections, Inc. and Rentokil Initial plc have shown remarkable growth over the past decade. From 2014 to 2023, Waste Connections, Inc. has consistently outperformed Rentokil Initial plc in terms of EBITDA, showcasing a robust growth trajectory. By 2023, Waste Connections, Inc.'s EBITDA surged by approximately 215% from its 2014 levels, reaching over 2.26 billion, while Rentokil Initial plc saw a more modest increase of around 182%, peaking at 1.16 billion.
This comparative analysis highlights Waste Connections, Inc.'s strategic advancements and market positioning, which have enabled it to nearly double its EBITDA compared to Rentokil Initial plc. As the industry continues to evolve, these insights provide a glimpse into the financial health and operational efficiency of these two giants, offering valuable lessons for stakeholders and investors alike.
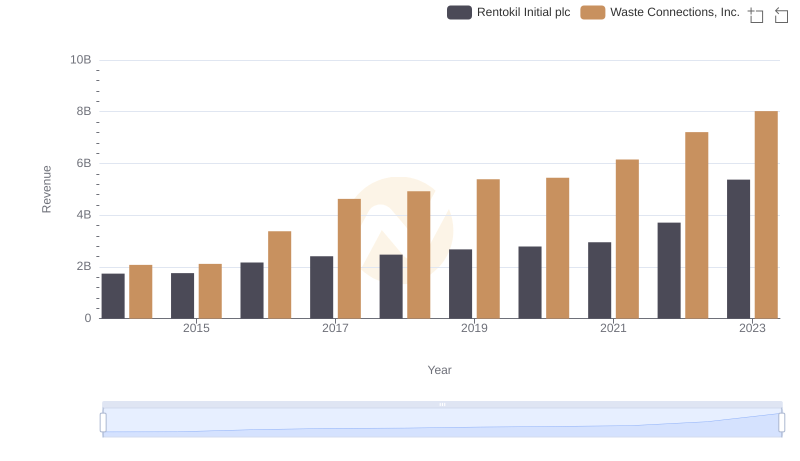
Revenue Insights: Waste Connections, Inc. and Rentokil Initial plc Performance Compared

Analyzing Cost of Revenue: Waste Connections, Inc. and Rentokil Initial plc
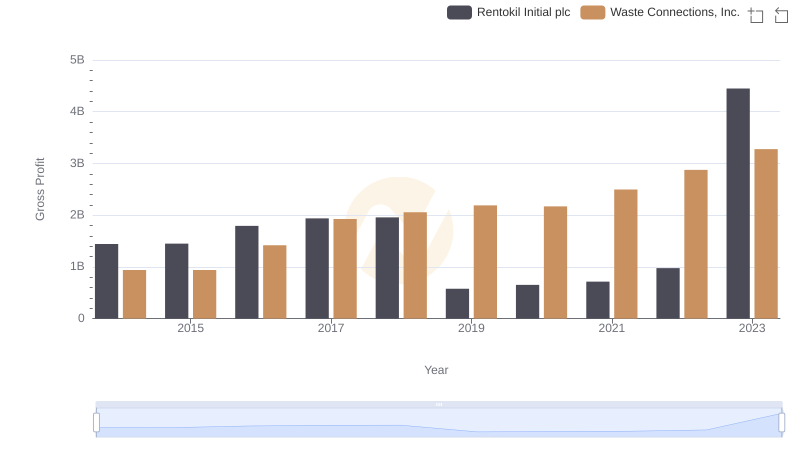
Gross Profit Analysis: Comparing Waste Connections, Inc. and Rentokil Initial plc
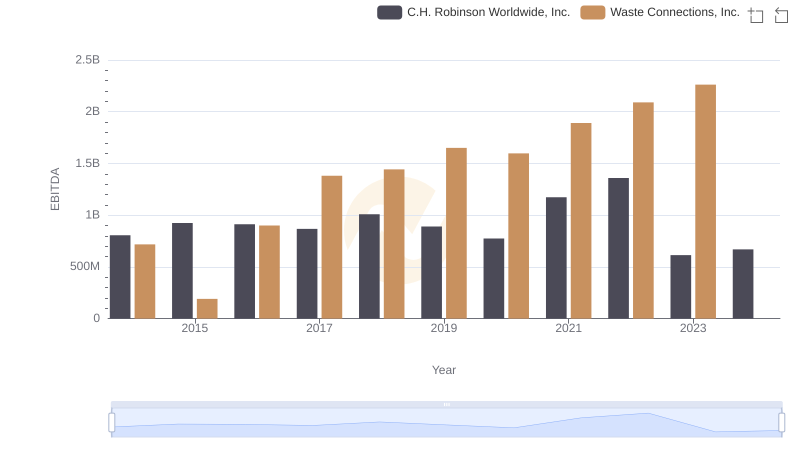
A Professional Review of EBITDA: Waste Connections, Inc. Compared to C.H. Robinson Worldwide, Inc.
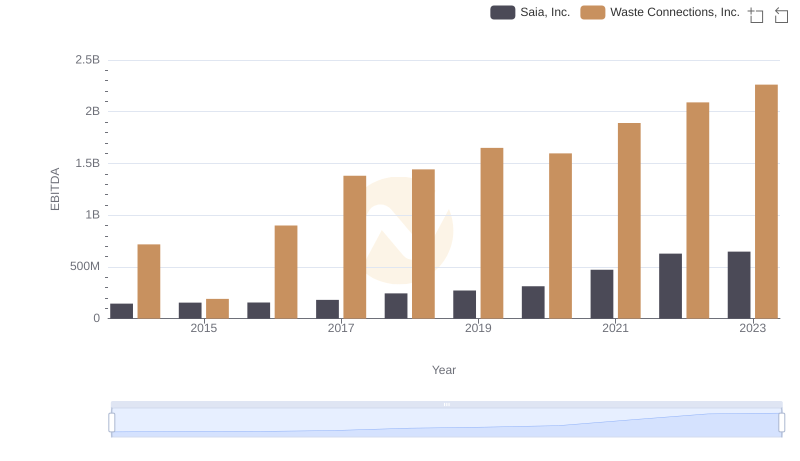
EBITDA Performance Review: Waste Connections, Inc. vs Saia, Inc.

Comprehensive EBITDA Comparison: Waste Connections, Inc. vs Nordson Corporation
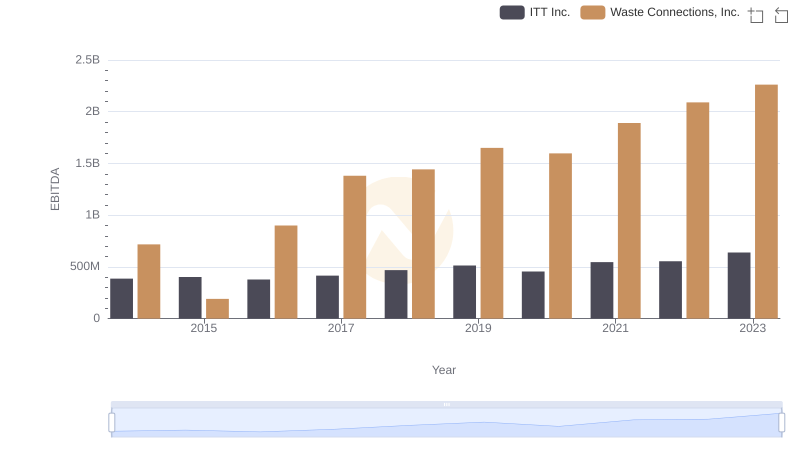
Comprehensive EBITDA Comparison: Waste Connections, Inc. vs ITT Inc.
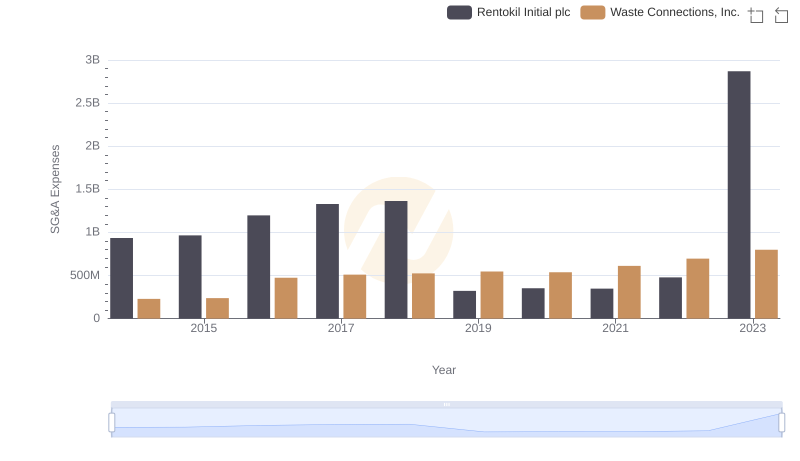
Comparing SG&A Expenses: Waste Connections, Inc. vs Rentokil Initial plc Trends and Insights
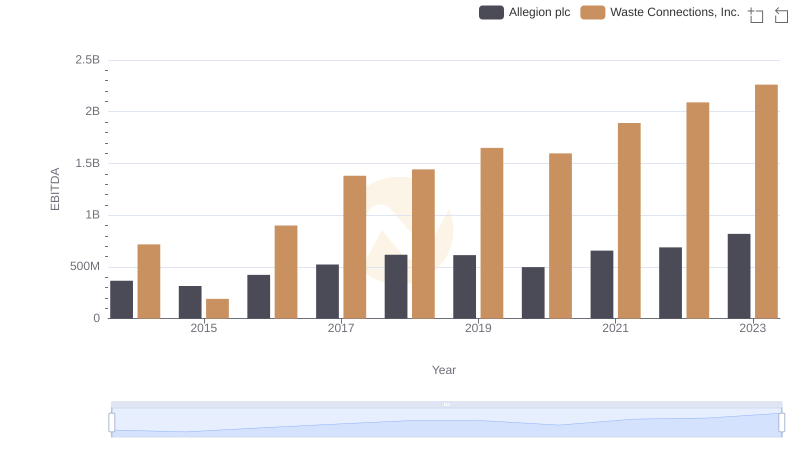
A Side-by-Side Analysis of EBITDA: Waste Connections, Inc. and Allegion plc