| __timestamp | Elbit Systems Ltd. | Waste Connections, Inc. |
|---|---|---|
| Wednesday, January 1, 2014 | 2133151000 | 1138388000 |
| Thursday, January 1, 2015 | 2210528000 | 1177409000 |
| Friday, January 1, 2016 | 2300636000 | 1957712000 |
| Sunday, January 1, 2017 | 2379905000 | 2704775000 |
| Monday, January 1, 2018 | 2707505000 | 2865704000 |
| Tuesday, January 1, 2019 | 3371933000 | 3198757000 |
| Wednesday, January 1, 2020 | 3497465000 | 3276808000 |
| Friday, January 1, 2021 | 3920473000 | 3654074000 |
| Saturday, January 1, 2022 | 4138266000 | 4336012000 |
| Sunday, January 1, 2023 | 4491790000 | 4744513000 |
| Monday, January 1, 2024 | 5191706000 |
Unveiling the hidden dimensions of data
In the ever-evolving landscape of global industries, understanding cost dynamics is crucial. Waste Connections, Inc. and Elbit Systems Ltd. offer a fascinating study in contrasts. From 2014 to 2023, Waste Connections, Inc. saw its cost of revenue surge by approximately 317%, reflecting its aggressive expansion and operational scaling. Meanwhile, Elbit Systems Ltd. experienced a 110% increase, indicative of steady growth in the defense sector.
By 2023, Waste Connections, Inc.'s cost of revenue reached nearly $4.7 billion, surpassing Elbit Systems Ltd.'s $4.5 billion. This shift highlights Waste Connections, Inc.'s rapid growth trajectory, especially post-2016, where it consistently outpaced Elbit Systems Ltd. in cost increments. Such trends underscore the differing strategic priorities and market conditions faced by these companies. As industries continue to evolve, these insights provide a window into the financial strategies shaping their futures.
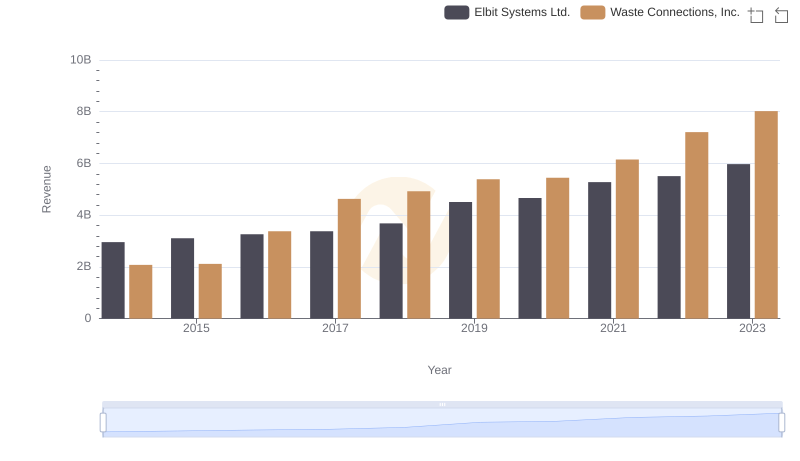
Revenue Showdown: Waste Connections, Inc. vs Elbit Systems Ltd.
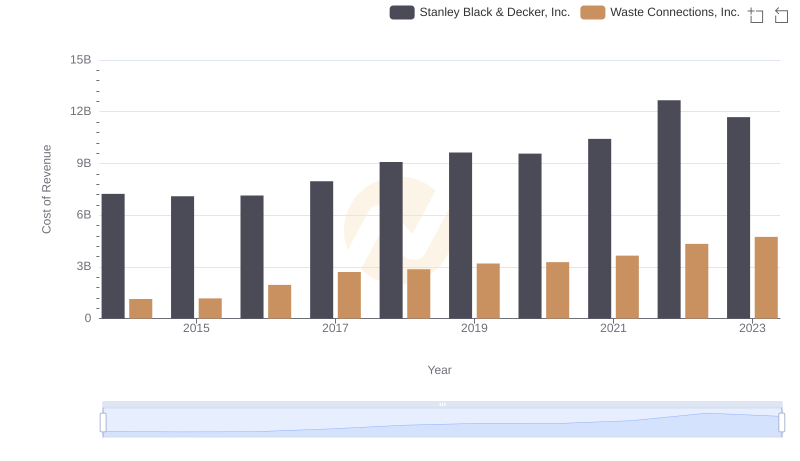
Cost Insights: Breaking Down Waste Connections, Inc. and Stanley Black & Decker, Inc.'s Expenses
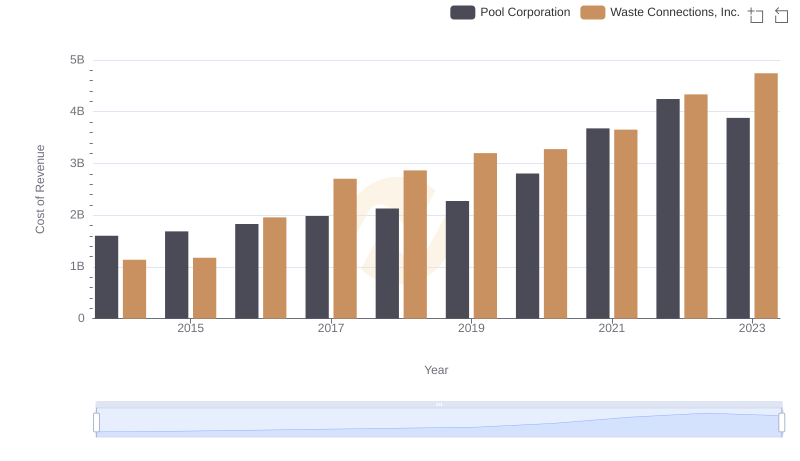
Waste Connections, Inc. vs Pool Corporation: Efficiency in Cost of Revenue Explored
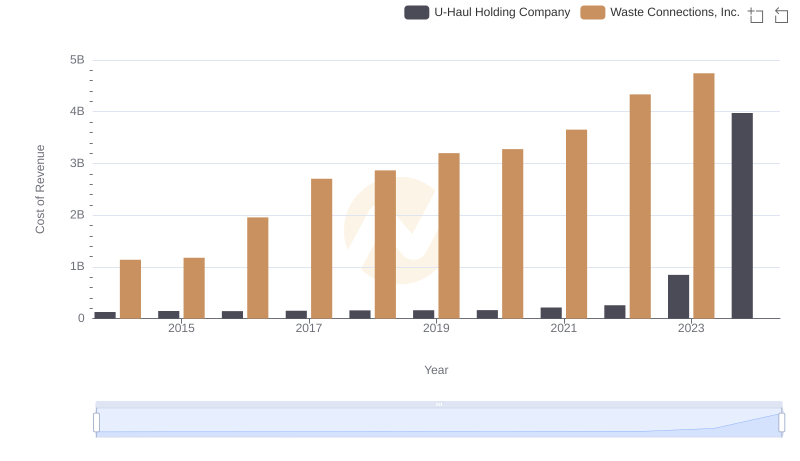
Cost of Revenue Trends: Waste Connections, Inc. vs U-Haul Holding Company
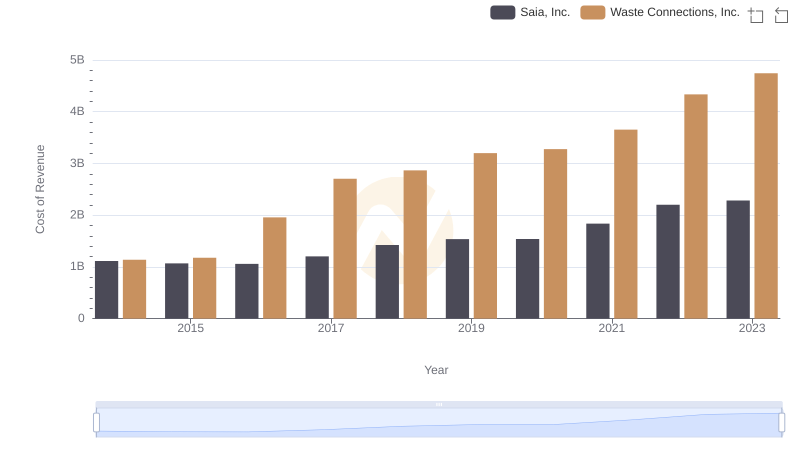
Cost Insights: Breaking Down Waste Connections, Inc. and Saia, Inc.'s Expenses
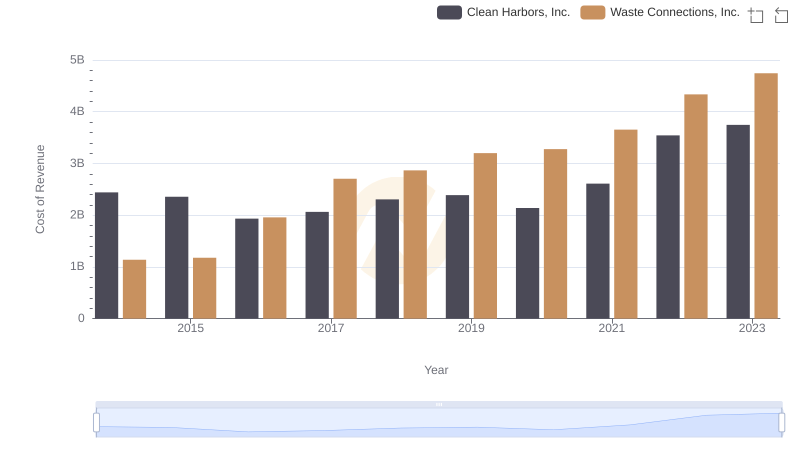
Waste Connections, Inc. vs Clean Harbors, Inc.: Efficiency in Cost of Revenue Explored
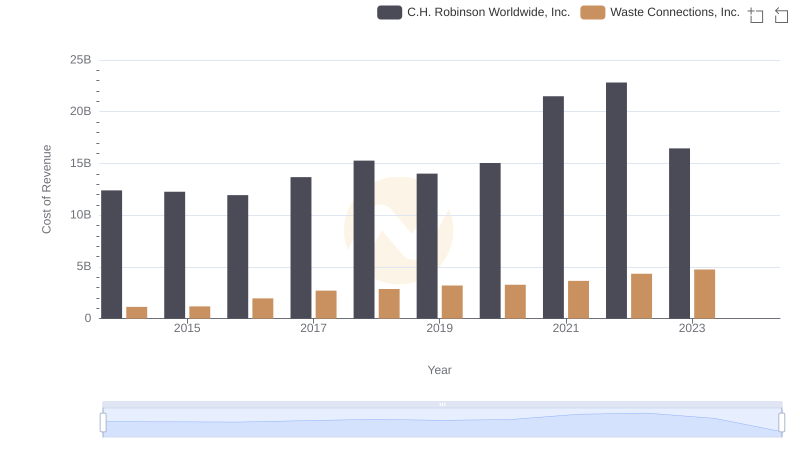
Analyzing Cost of Revenue: Waste Connections, Inc. and C.H. Robinson Worldwide, Inc.
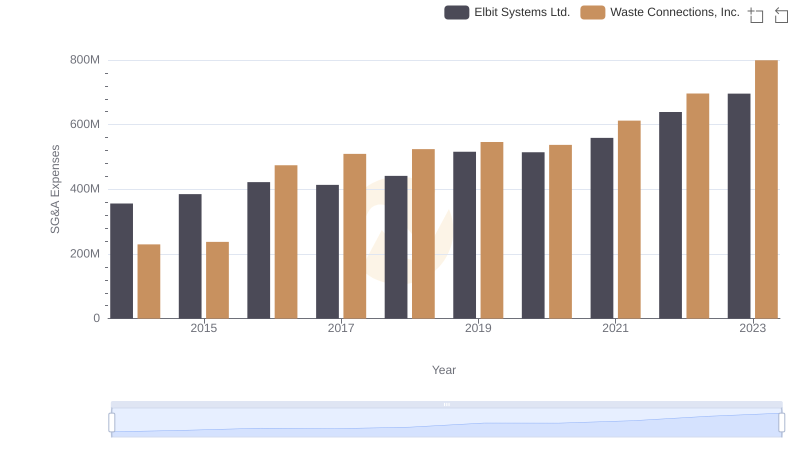
Waste Connections, Inc. and Elbit Systems Ltd.: SG&A Spending Patterns Compared
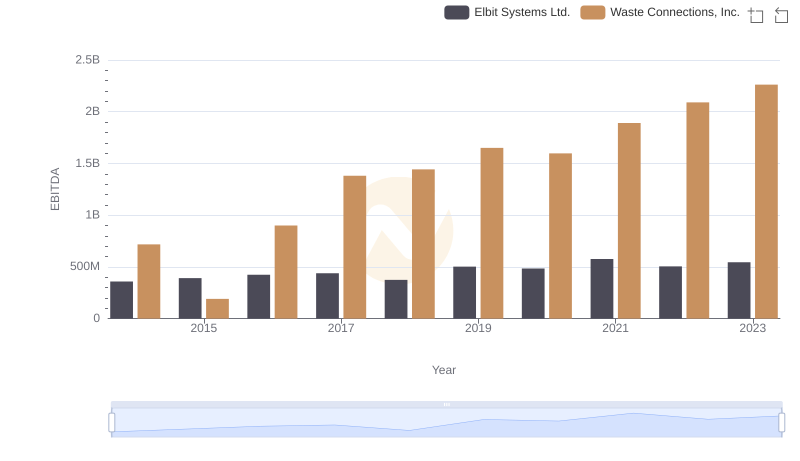
Comprehensive EBITDA Comparison: Waste Connections, Inc. vs Elbit Systems Ltd.