| __timestamp | C.H. Robinson Worldwide, Inc. | Waste Connections, Inc. |
|---|---|---|
| Wednesday, January 1, 2014 | 12401436000 | 1138388000 |
| Thursday, January 1, 2015 | 12259014000 | 1177409000 |
| Friday, January 1, 2016 | 11931821000 | 1957712000 |
| Sunday, January 1, 2017 | 13680857000 | 2704775000 |
| Monday, January 1, 2018 | 15269479000 | 2865704000 |
| Tuesday, January 1, 2019 | 14021726000 | 3198757000 |
| Wednesday, January 1, 2020 | 15037716000 | 3276808000 |
| Friday, January 1, 2021 | 21493659000 | 3654074000 |
| Saturday, January 1, 2022 | 22826428000 | 4336012000 |
| Sunday, January 1, 2023 | 16457570000 | 4744513000 |
| Monday, January 1, 2024 | 16416191000 | 5191706000 |
Unleashing insights
In the ever-evolving landscape of logistics and waste management, understanding cost dynamics is crucial. From 2014 to 2023, C.H. Robinson Worldwide, Inc. and Waste Connections, Inc. have shown distinct trends in their cost of revenue. C.H. Robinson, a leader in logistics, saw its cost of revenue peak in 2022, with a staggering 62% increase from 2014. However, 2023 marked a decline, indicating potential shifts in operational strategies or market conditions. Meanwhile, Waste Connections, a key player in waste management, experienced a consistent upward trajectory, with costs nearly quadrupling over the same period. This growth reflects the increasing demand for sustainable waste solutions. Notably, 2024 data is missing, suggesting a need for updated insights. These trends highlight the dynamic nature of these industries and the importance of strategic cost management.
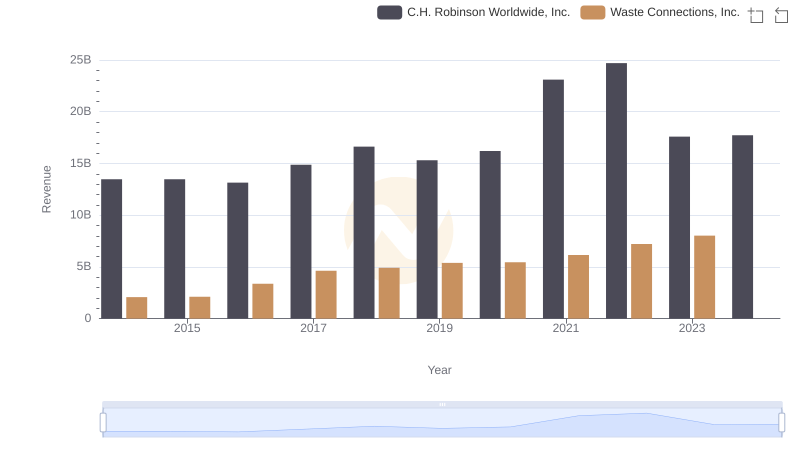
Revenue Insights: Waste Connections, Inc. and C.H. Robinson Worldwide, Inc. Performance Compared
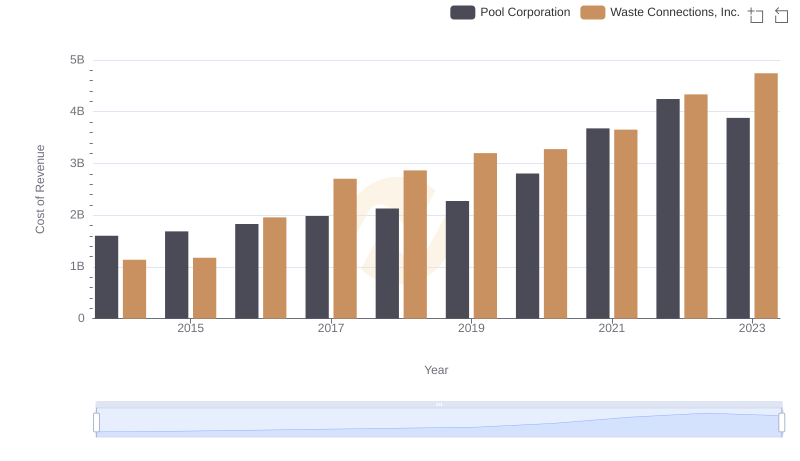
Waste Connections, Inc. vs Pool Corporation: Efficiency in Cost of Revenue Explored
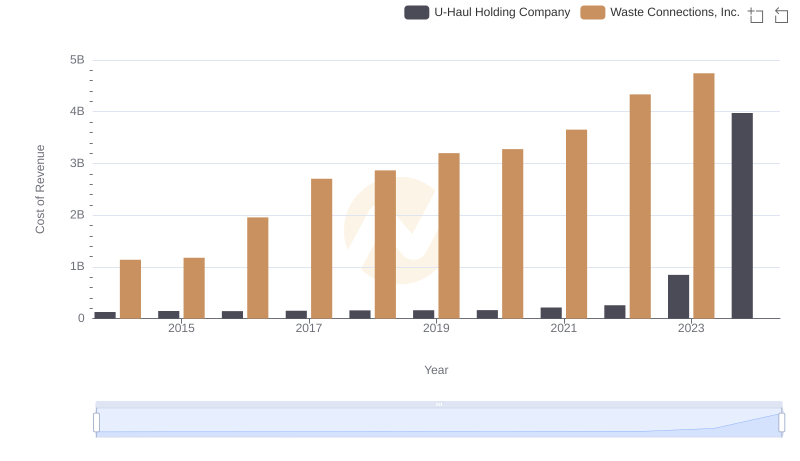
Cost of Revenue Trends: Waste Connections, Inc. vs U-Haul Holding Company
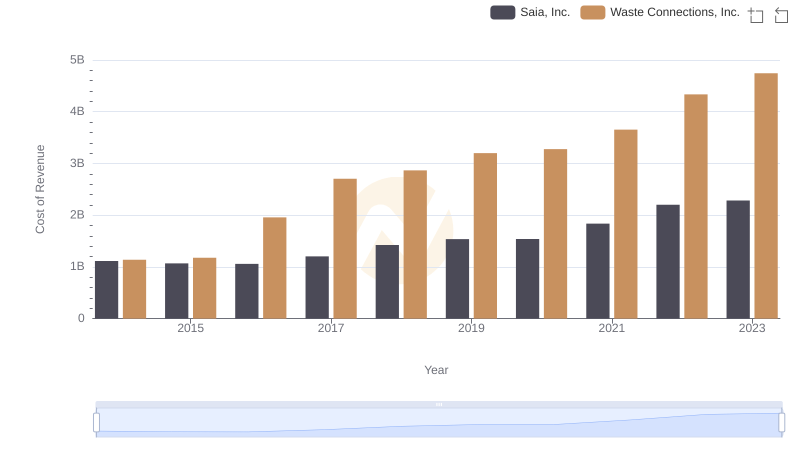
Cost Insights: Breaking Down Waste Connections, Inc. and Saia, Inc.'s Expenses
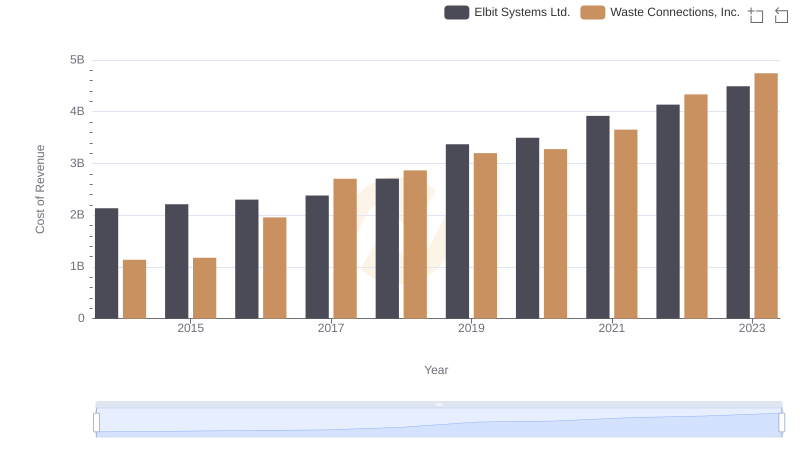
Cost of Revenue Trends: Waste Connections, Inc. vs Elbit Systems Ltd.
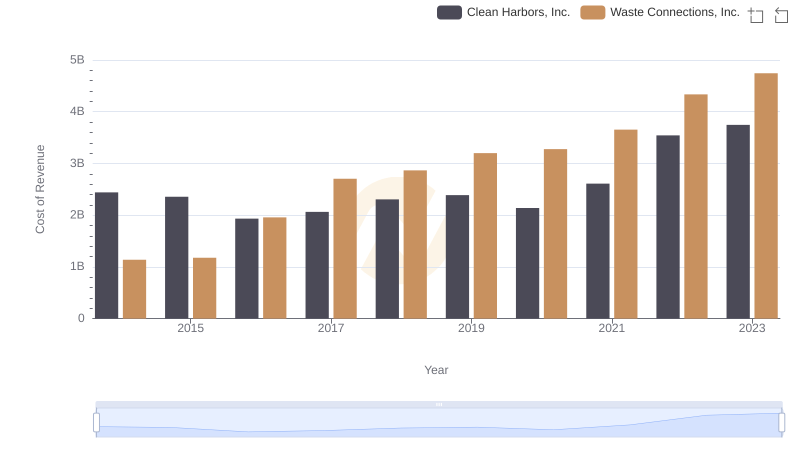
Waste Connections, Inc. vs Clean Harbors, Inc.: Efficiency in Cost of Revenue Explored
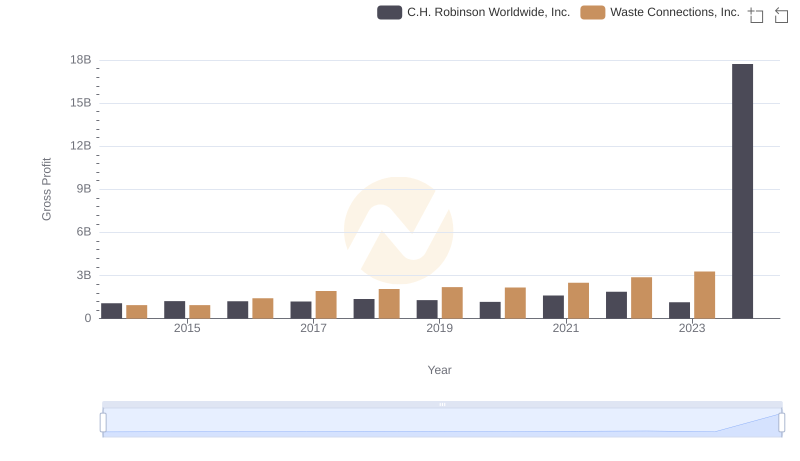
Key Insights on Gross Profit: Waste Connections, Inc. vs C.H. Robinson Worldwide, Inc.
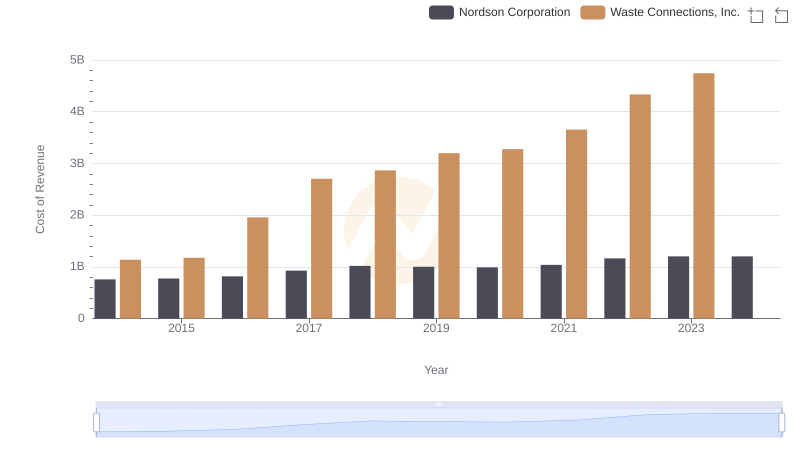
Cost of Revenue Trends: Waste Connections, Inc. vs Nordson Corporation
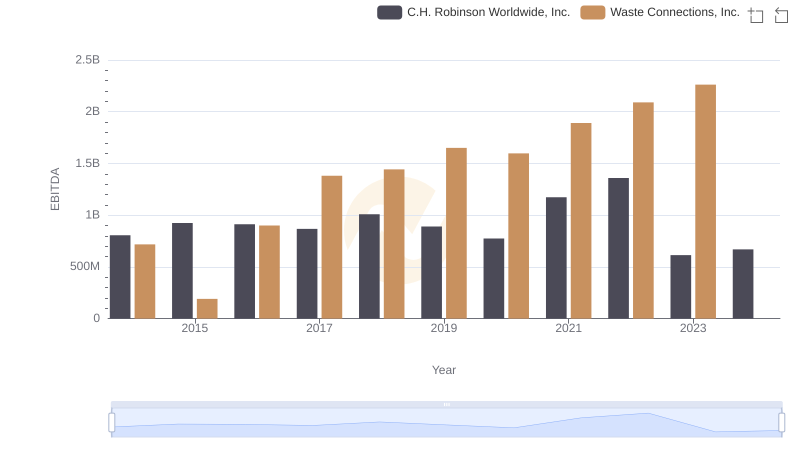
A Professional Review of EBITDA: Waste Connections, Inc. Compared to C.H. Robinson Worldwide, Inc.