| __timestamp | Pentair plc | United Rentals, Inc. |
|---|---|---|
| Wednesday, January 1, 2014 | 1109300000 | 1678000000 |
| Thursday, January 1, 2015 | 842400000 | 2653000000 |
| Friday, January 1, 2016 | 890400000 | 2566000000 |
| Sunday, January 1, 2017 | 488600000 | 2843000000 |
| Monday, January 1, 2018 | 552800000 | 3628000000 |
| Tuesday, January 1, 2019 | 513200000 | 4200000000 |
| Wednesday, January 1, 2020 | 527600000 | 2195000000 |
| Friday, January 1, 2021 | 714400000 | 2642000000 |
| Saturday, January 1, 2022 | 830400000 | 5464000000 |
| Sunday, January 1, 2023 | 852000000 | 6627000000 |
| Monday, January 1, 2024 | 803800000 | 4516000000 |
Unleashing insights
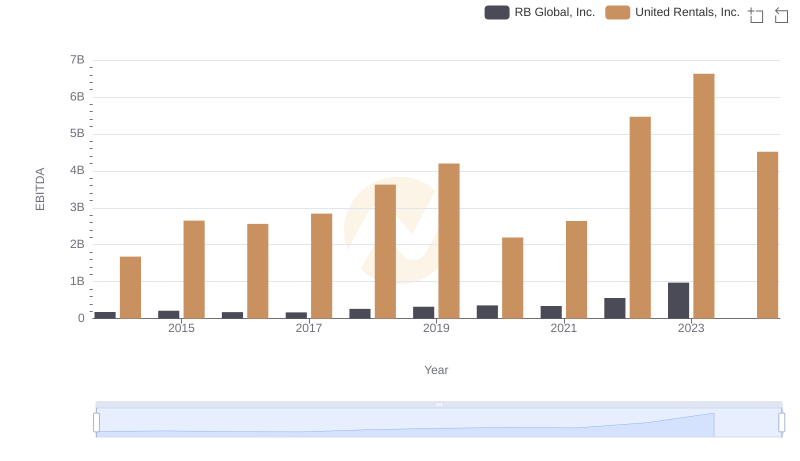
In the ever-evolving landscape of industrial services, United Rentals, Inc. and Pentair plc have showcased contrasting trajectories over the past decade. From 2014 to 2023, United Rentals has consistently outperformed Pentair in terms of EBITDA, reflecting a robust growth strategy. In 2014, United Rentals' EBITDA was approximately 51% higher than Pentair's. By 2023, this gap widened significantly, with United Rentals achieving an EBITDA nearly 678% higher than Pentair's.
Pentair, while maintaining a steady performance, saw its EBITDA peak in 2014 and 2016, only to experience fluctuations thereafter. In contrast, United Rentals demonstrated resilience and adaptability, with a notable surge in 2022 and 2023, marking a 147% increase from its 2014 figures. This comparison highlights the dynamic nature of the industry and the strategic maneuvers that can lead to significant financial outcomes.
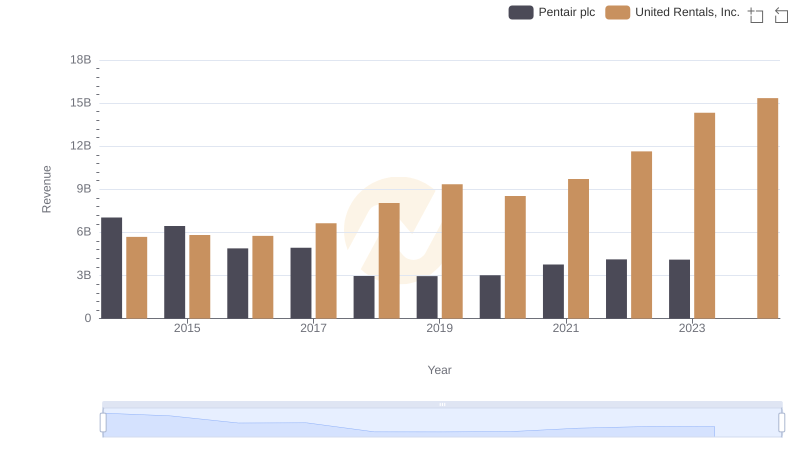
Revenue Showdown: United Rentals, Inc. vs Pentair plc
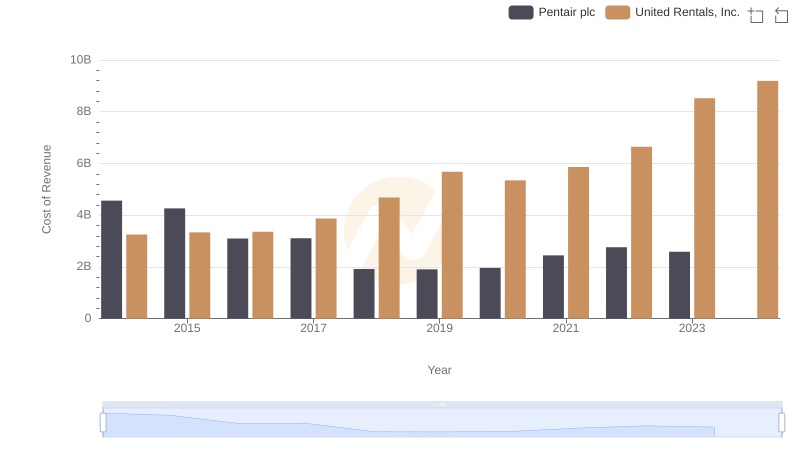
Analyzing Cost of Revenue: United Rentals, Inc. and Pentair plc
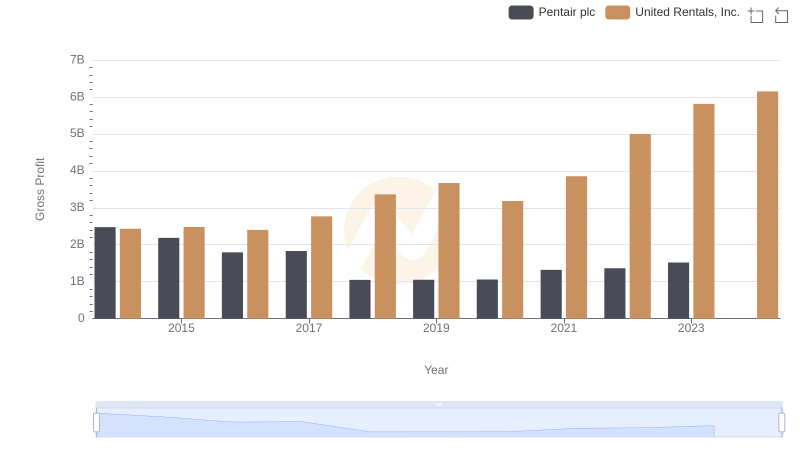
Who Generates Higher Gross Profit? United Rentals, Inc. or Pentair plc
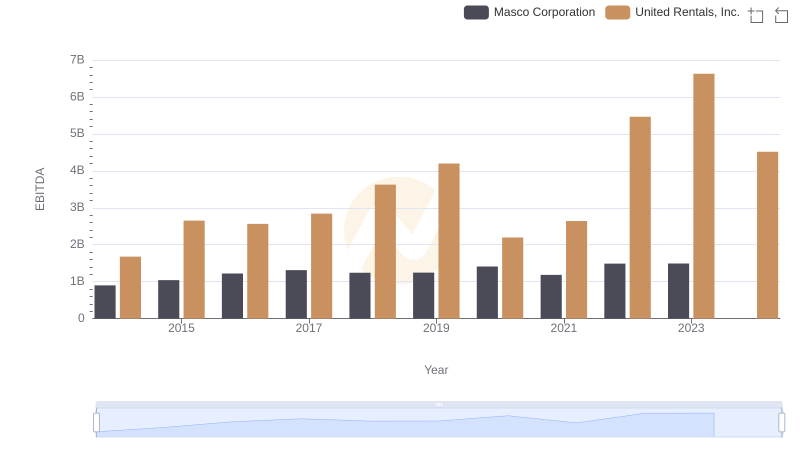
United Rentals, Inc. and Masco Corporation: A Detailed Examination of EBITDA Performance
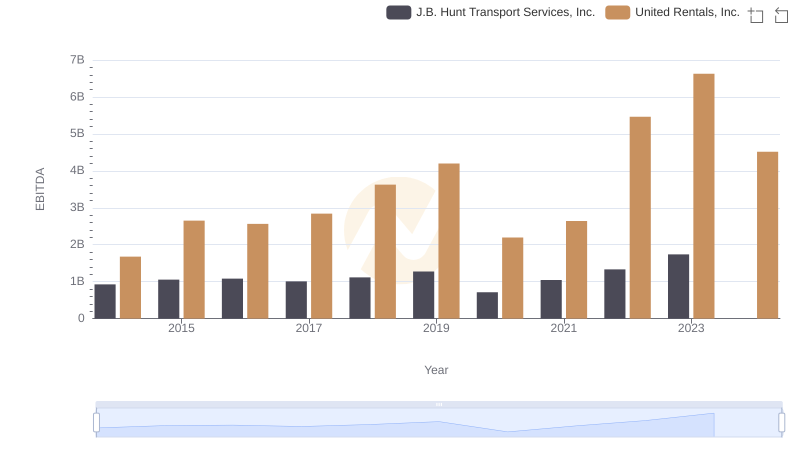
EBITDA Analysis: Evaluating United Rentals, Inc. Against J.B. Hunt Transport Services, Inc.
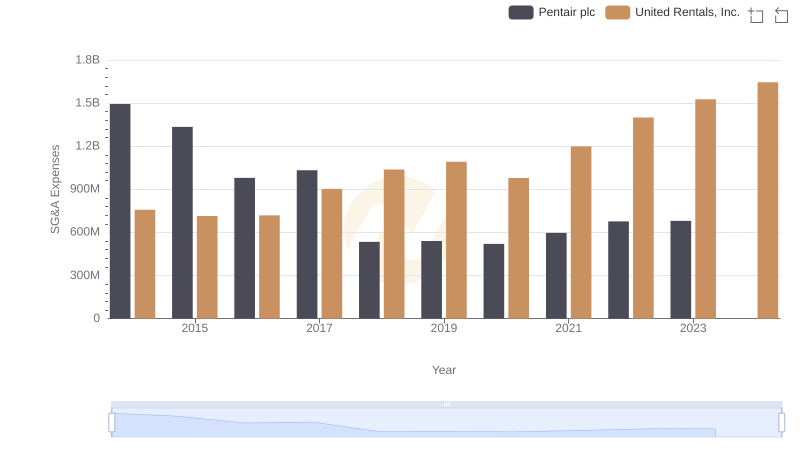
United Rentals, Inc. vs Pentair plc: SG&A Expense Trends

Comparative EBITDA Analysis: United Rentals, Inc. vs IDEX Corporation
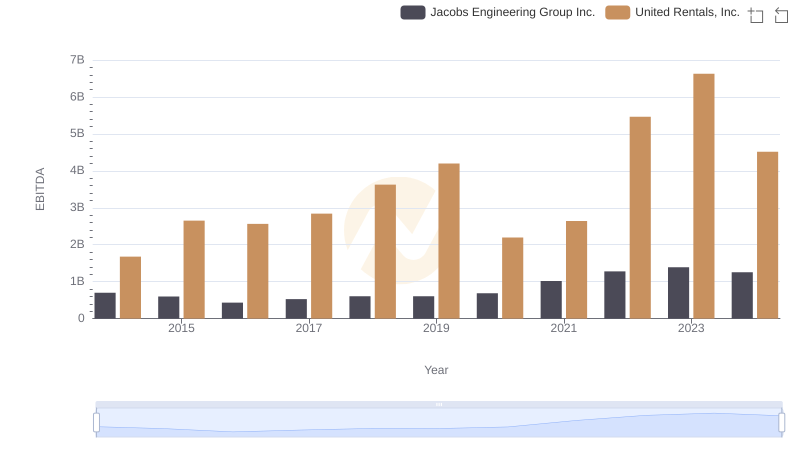
EBITDA Performance Review: United Rentals, Inc. vs Jacobs Engineering Group Inc.
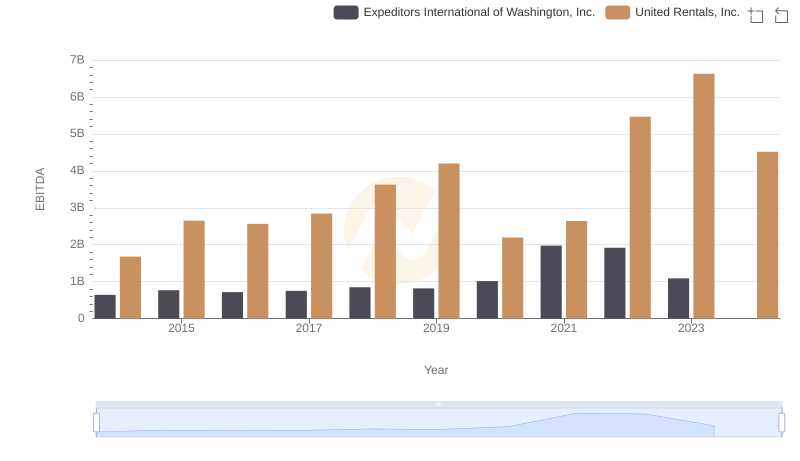
A Side-by-Side Analysis of EBITDA: United Rentals, Inc. and Expeditors International of Washington, Inc.

United Rentals, Inc. vs Owens Corning: In-Depth EBITDA Performance Comparison
Comprehensive EBITDA Comparison: United Rentals, Inc. vs RB Global, Inc.