| __timestamp | Intuit Inc. | PTC Inc. |
|---|---|---|
| Wednesday, January 1, 2014 | 668000000 | 373683000 |
| Thursday, January 1, 2015 | 725000000 | 334734000 |
| Friday, January 1, 2016 | 752000000 | 325665000 |
| Sunday, January 1, 2017 | 809000000 | 329019000 |
| Monday, January 1, 2018 | 977000000 | 326194000 |
| Tuesday, January 1, 2019 | 1167000000 | 325378000 |
| Wednesday, January 1, 2020 | 1378000000 | 334271000 |
| Friday, January 1, 2021 | 1683000000 | 371102000 |
| Saturday, January 1, 2022 | 2406000000 | 385980000 |
| Sunday, January 1, 2023 | 3143000000 | 441006000 |
| Monday, January 1, 2024 | 3465000000 | 486834000 |
Unleashing the power of data
In the ever-evolving landscape of financial technology, understanding cost structures is pivotal. Over the past decade, Intuit Inc. and PTC Inc. have showcased intriguing trends in their cost of revenue. From 2014 to 2024, Intuit's cost of revenue surged by over 400%, reflecting its aggressive growth strategy and expanding market footprint. In contrast, PTC Inc. experienced a more modest increase of approximately 30%, indicating a stable yet cautious approach.
These insights underscore the strategic differences between the two companies, offering a window into their financial health and market strategies.
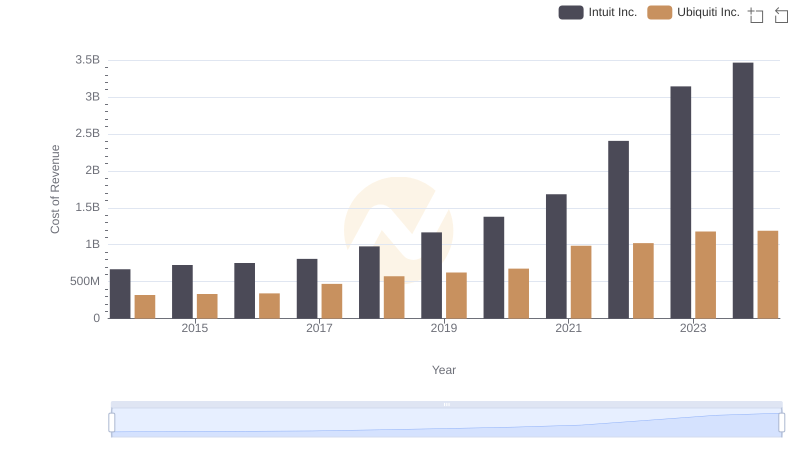
Cost of Revenue Comparison: Intuit Inc. vs Ubiquiti Inc.
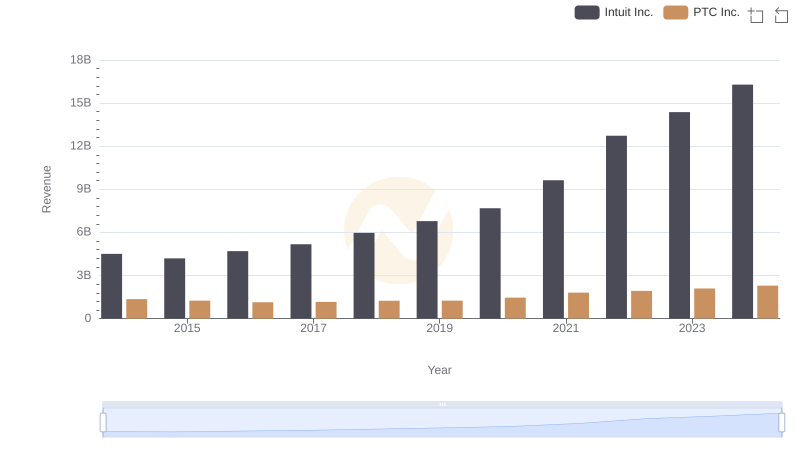
Annual Revenue Comparison: Intuit Inc. vs PTC Inc.
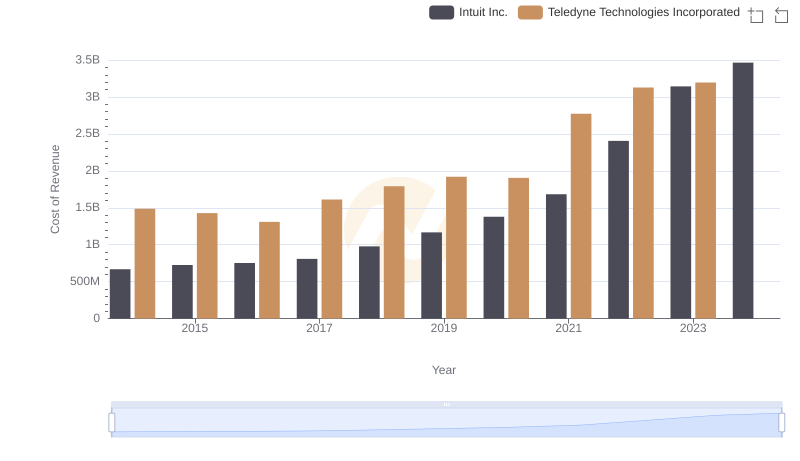
Intuit Inc. vs Teledyne Technologies Incorporated: Efficiency in Cost of Revenue Explored
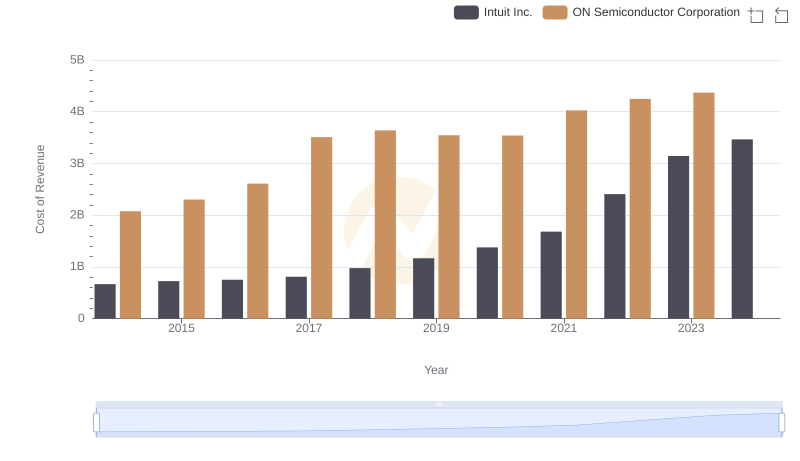
Comparing Cost of Revenue Efficiency: Intuit Inc. vs ON Semiconductor Corporation
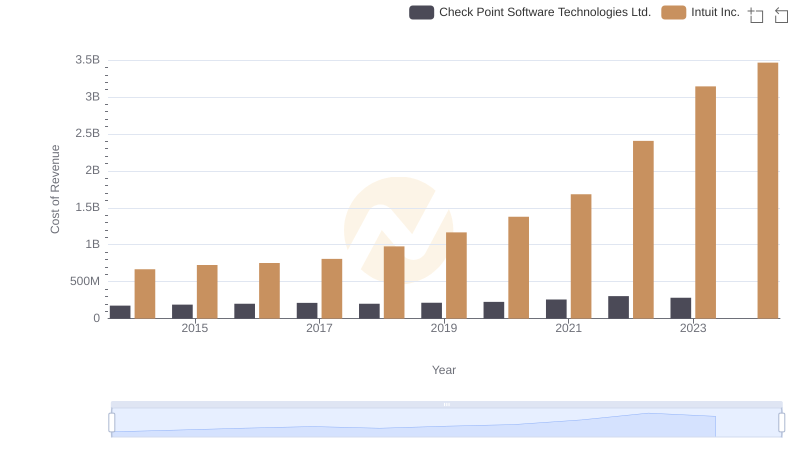
Comparing Cost of Revenue Efficiency: Intuit Inc. vs Check Point Software Technologies Ltd.
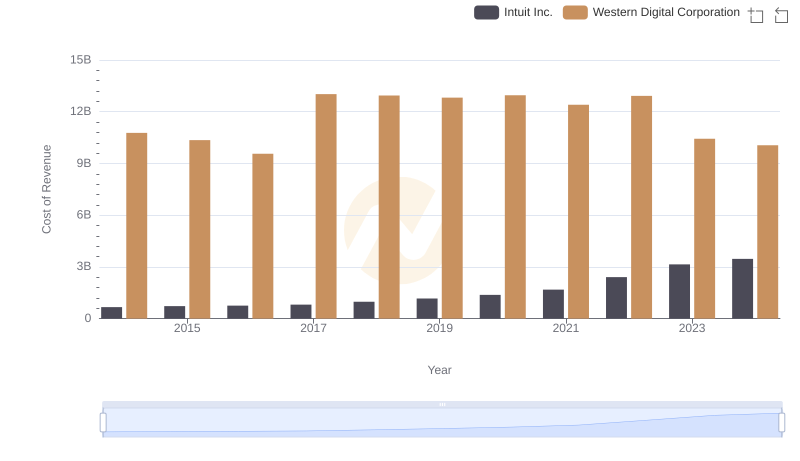
Cost of Revenue Trends: Intuit Inc. vs Western Digital Corporation
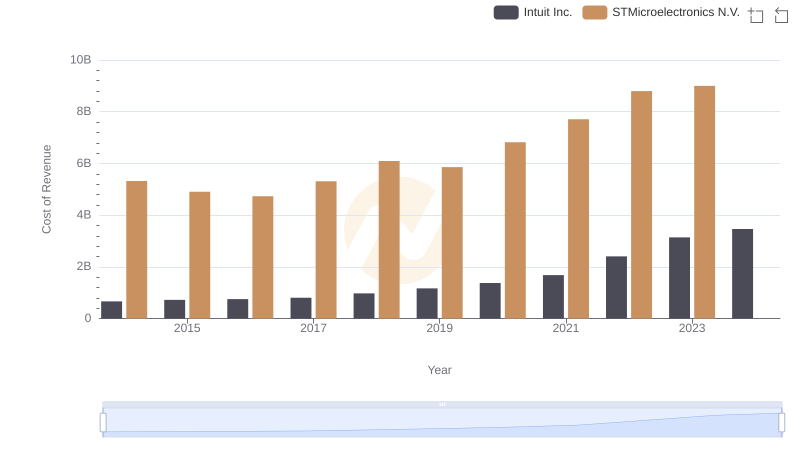
Cost Insights: Breaking Down Intuit Inc. and STMicroelectronics N.V.'s Expenses
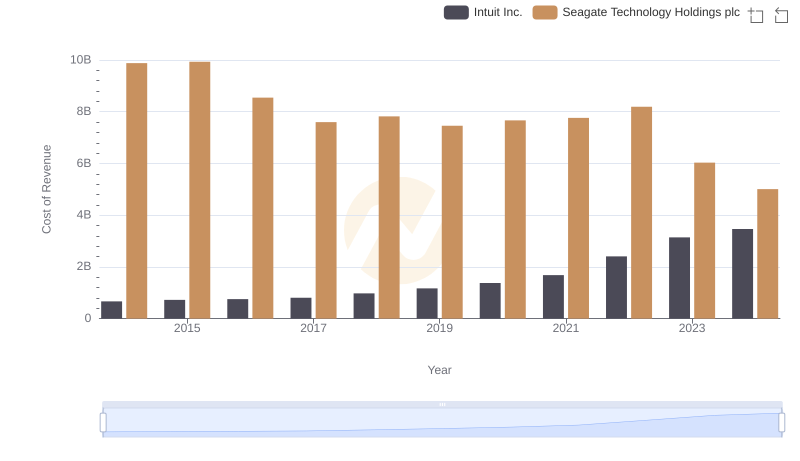
Cost Insights: Breaking Down Intuit Inc. and Seagate Technology Holdings plc's Expenses
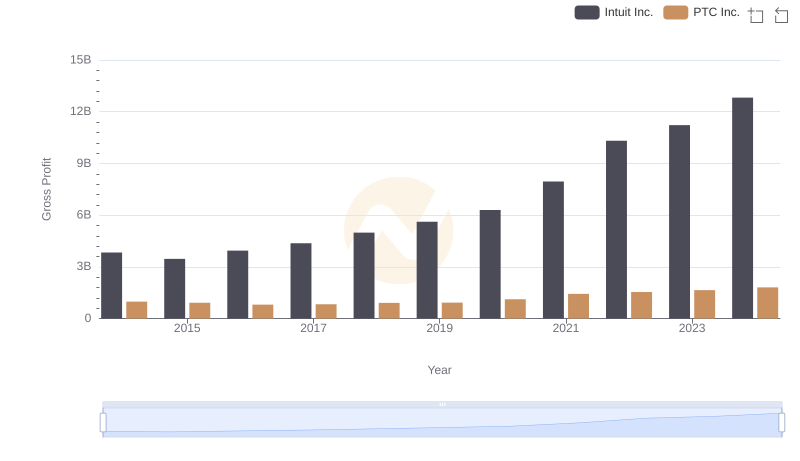
Gross Profit Analysis: Comparing Intuit Inc. and PTC Inc.
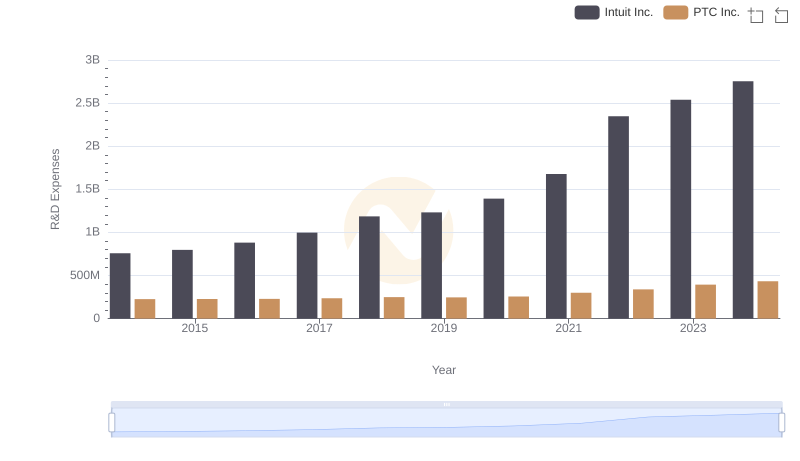
Who Prioritizes Innovation? R&D Spending Compared for Intuit Inc. and PTC Inc.
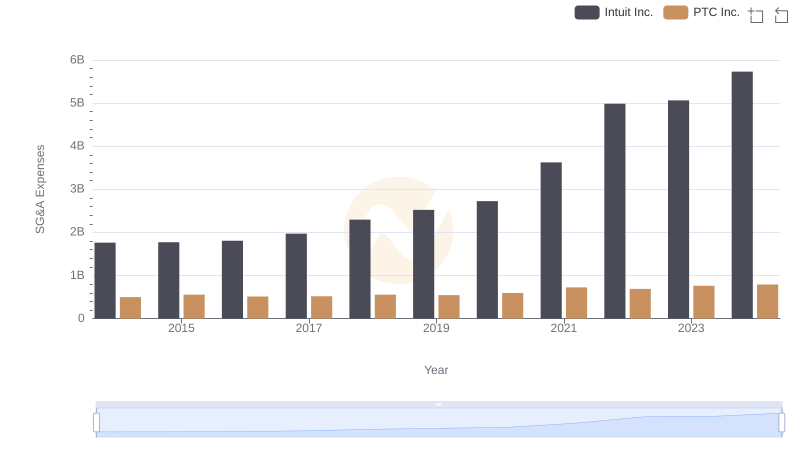
Selling, General, and Administrative Costs: Intuit Inc. vs PTC Inc.
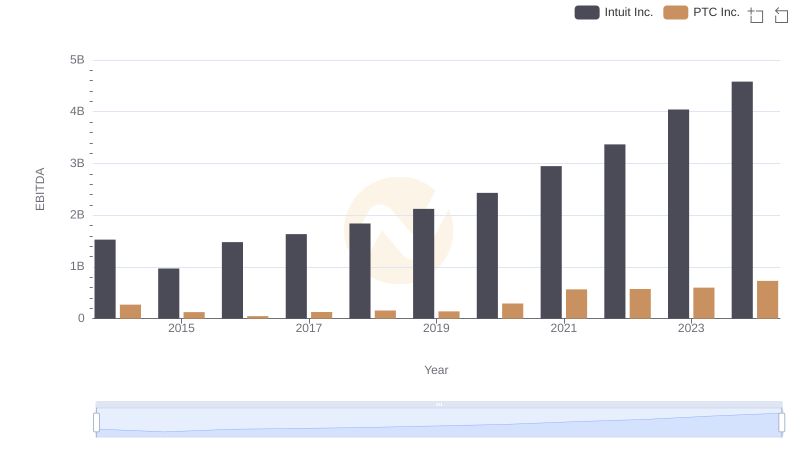
Intuit Inc. vs PTC Inc.: In-Depth EBITDA Performance Comparison