| __timestamp | Intuit Inc. | Pure Storage, Inc. |
|---|---|---|
| Wednesday, January 1, 2014 | 1762000000 | 60652000 |
| Thursday, January 1, 2015 | 1771000000 | 184674000 |
| Friday, January 1, 2016 | 1807000000 | 315976000 |
| Sunday, January 1, 2017 | 1973000000 | 444687000 |
| Monday, January 1, 2018 | 2298000000 | 575200000 |
| Tuesday, January 1, 2019 | 2524000000 | 721617000 |
| Wednesday, January 1, 2020 | 2727000000 | 891175000 |
| Friday, January 1, 2021 | 3626000000 | 898491000 |
| Saturday, January 1, 2022 | 4986000000 | 988982000 |
| Sunday, January 1, 2023 | 5062000000 | 1121605000 |
| Monday, January 1, 2024 | 5730000000 | 1197264000 |
Infusing magic into the data realm
In the ever-evolving landscape of corporate finance, understanding the trends in Selling, General, and Administrative (SG&A) expenses can offer valuable insights into a company's operational efficiency. Over the past decade, Intuit Inc. and Pure Storage, Inc. have shown contrasting trajectories in their SG&A expenses.
From 2014 to 2024, Intuit Inc. has seen a steady increase in its SG&A expenses, growing by over 225%. This reflects its expansive growth strategy and investment in administrative capabilities. In contrast, Pure Storage, Inc. has experienced a more moderate increase of approximately 1,870%, indicative of its rapid scaling and market penetration efforts.
These trends highlight the strategic priorities of each company, with Intuit focusing on sustained growth and Pure Storage on aggressive expansion. As we look to the future, these patterns may offer clues about each company's competitive positioning and market strategy.
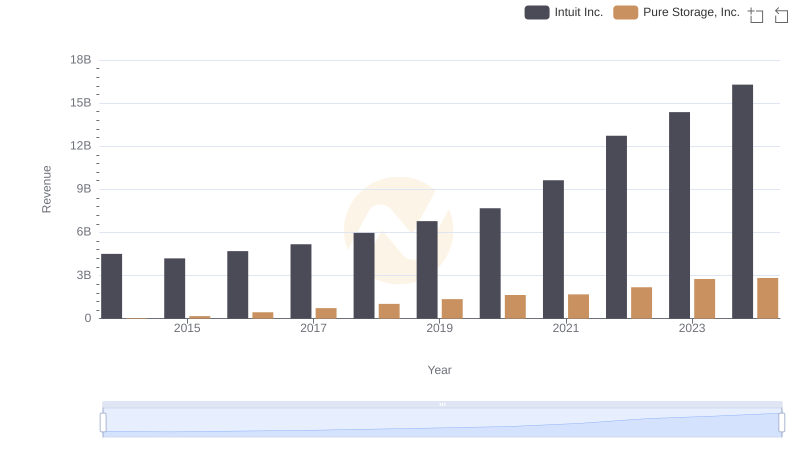
Intuit Inc. or Pure Storage, Inc.: Who Leads in Yearly Revenue?
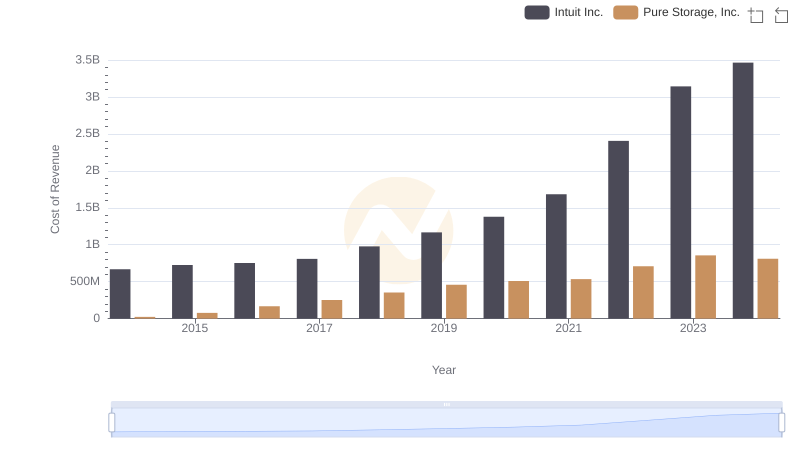
Analyzing Cost of Revenue: Intuit Inc. and Pure Storage, Inc.
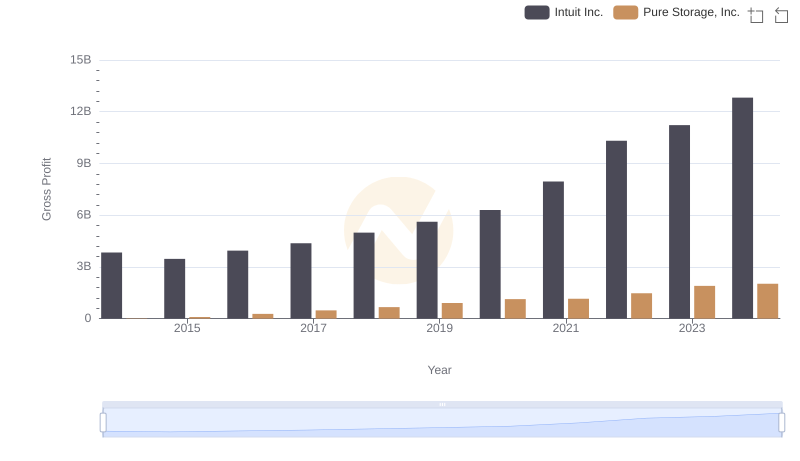
Intuit Inc. vs Pure Storage, Inc.: A Gross Profit Performance Breakdown
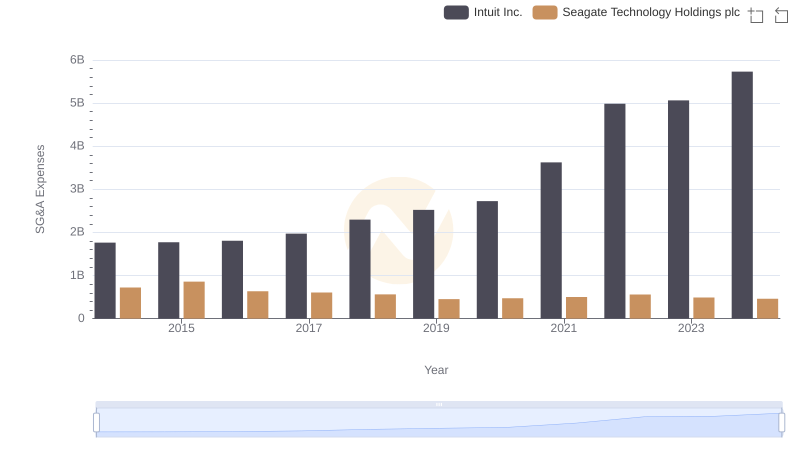
Cost Management Insights: SG&A Expenses for Intuit Inc. and Seagate Technology Holdings plc
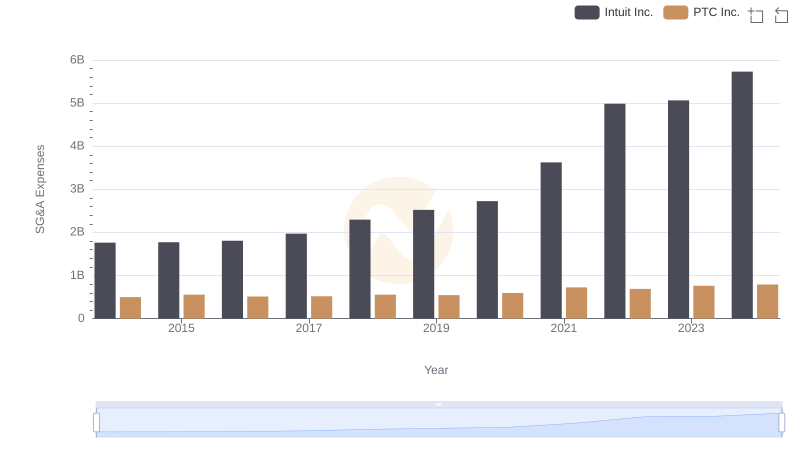
Selling, General, and Administrative Costs: Intuit Inc. vs PTC Inc.
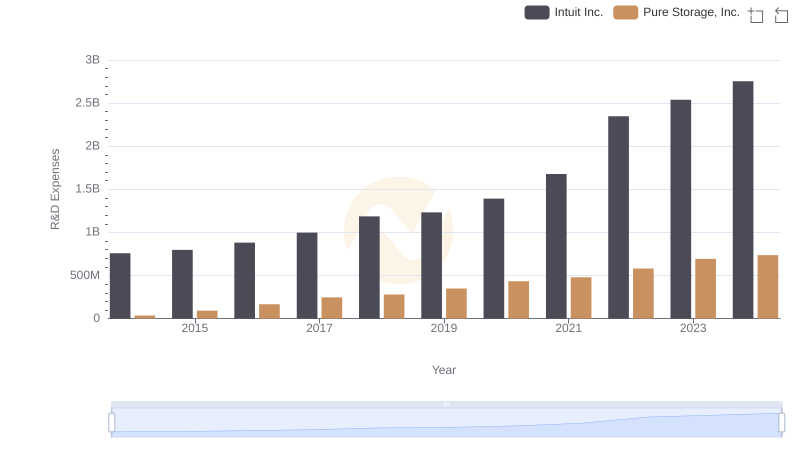
R&D Spending Showdown: Intuit Inc. vs Pure Storage, Inc.
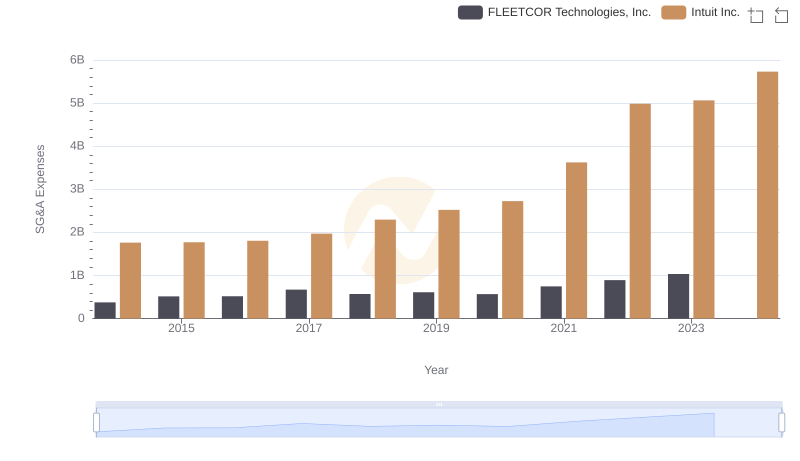
Comparing SG&A Expenses: Intuit Inc. vs FLEETCOR Technologies, Inc. Trends and Insights

Operational Costs Compared: SG&A Analysis of Intuit Inc. and Zebra Technologies Corporation
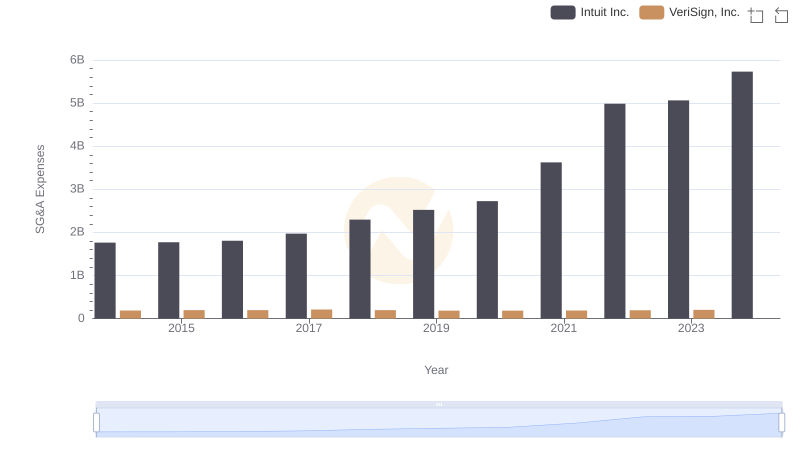
Intuit Inc. vs VeriSign, Inc.: SG&A Expense Trends
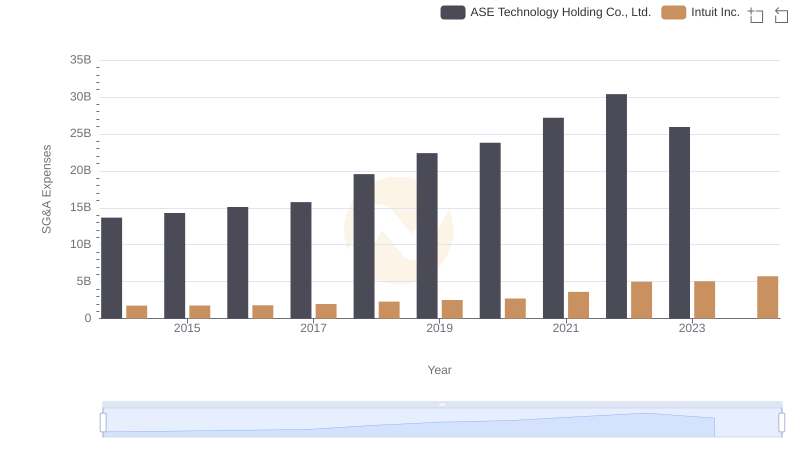
Cost Management Insights: SG&A Expenses for Intuit Inc. and ASE Technology Holding Co., Ltd.
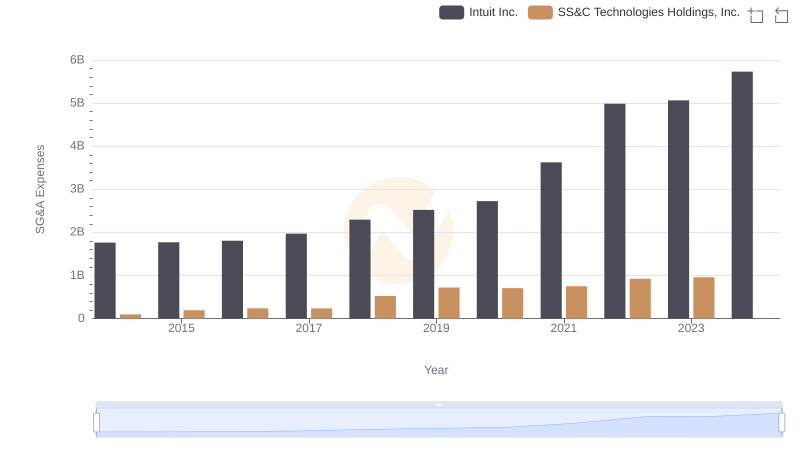
Cost Management Insights: SG&A Expenses for Intuit Inc. and SS&C Technologies Holdings, Inc.

Intuit Inc. and Teradyne, Inc.: SG&A Spending Patterns Compared