| __timestamp | Cisco Systems, Inc. | Splunk Inc. |
|---|---|---|
| Wednesday, January 1, 2014 | 27769000000 | 266798000 |
| Thursday, January 1, 2015 | 29681000000 | 382497000 |
| Friday, January 1, 2016 | 30960000000 | 554313000 |
| Sunday, January 1, 2017 | 30224000000 | 758902000 |
| Monday, January 1, 2018 | 30606000000 | 1014379000 |
| Tuesday, January 1, 2019 | 32666000000 | 1458334000 |
| Wednesday, January 1, 2020 | 31683000000 | 1929138000 |
| Friday, January 1, 2021 | 31894000000 | 1682040000 |
| Saturday, January 1, 2022 | 32248000000 | 1939695000 |
| Sunday, January 1, 2023 | 35753000000 | 2837713000 |
| Monday, January 1, 2024 | 34828000000 | 3350088000 |
Unleashing insights
In the ever-evolving tech landscape, Cisco Systems, Inc. and Splunk Inc. have carved distinct paths. From 2014 to 2024, Cisco's gross profit consistently outpaced Splunk's, showcasing its dominance in the networking sector. Cisco's gross profit surged by approximately 25% over the decade, peaking at $35.8 billion in 2023. In contrast, Splunk, a leader in data analytics, demonstrated impressive growth, with its gross profit increasing more than tenfold, reaching $3.35 billion in 2024.
This comparison underscores the diverse strategies and market dynamics shaping these tech titans, offering valuable insights for investors and industry enthusiasts alike.
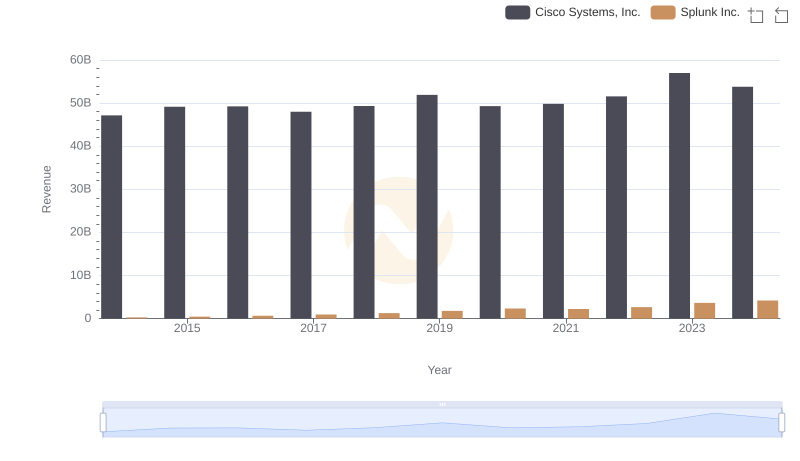
Cisco Systems, Inc. vs Splunk Inc.: Annual Revenue Growth Compared
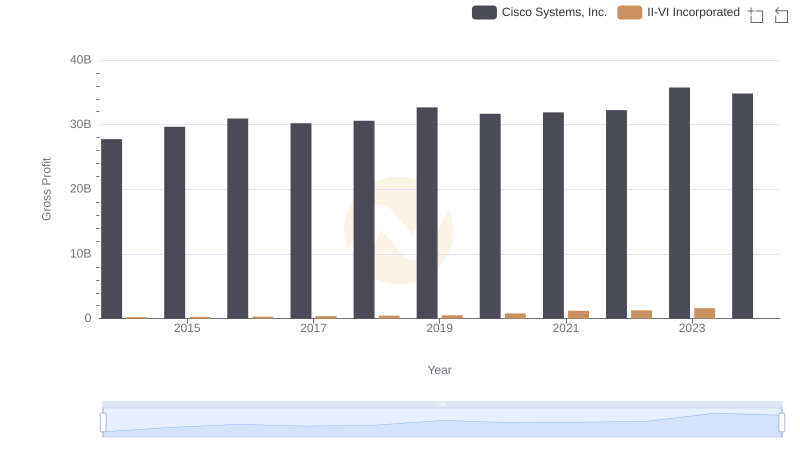
Gross Profit Analysis: Comparing Cisco Systems, Inc. and II-VI Incorporated
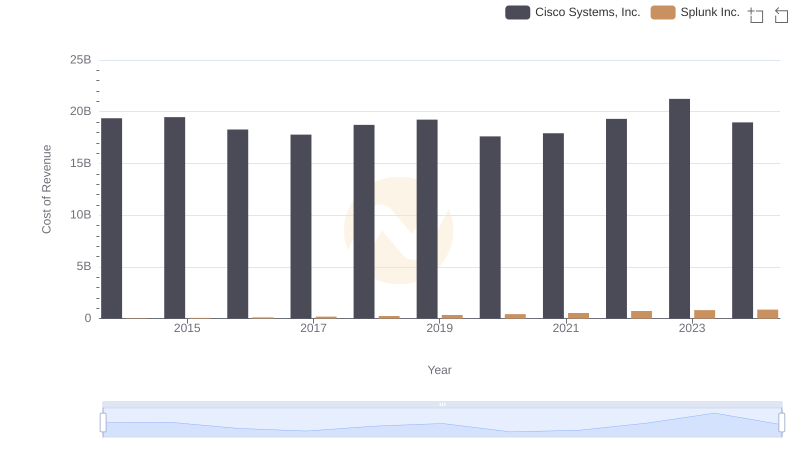
Analyzing Cost of Revenue: Cisco Systems, Inc. and Splunk Inc.
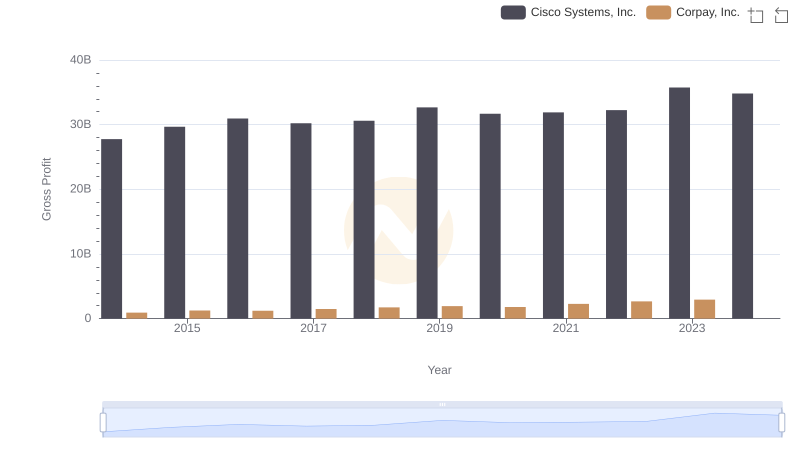
Gross Profit Comparison: Cisco Systems, Inc. and Corpay, Inc. Trends
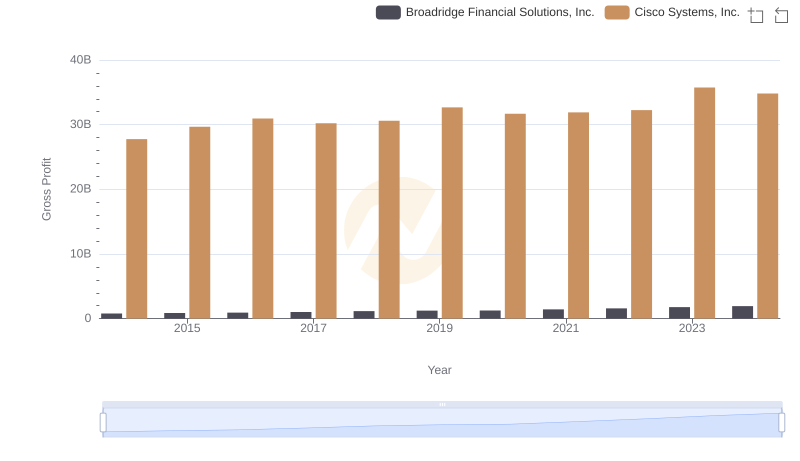
Gross Profit Comparison: Cisco Systems, Inc. and Broadridge Financial Solutions, Inc. Trends

Gross Profit Analysis: Comparing Cisco Systems, Inc. and Tyler Technologies, Inc.
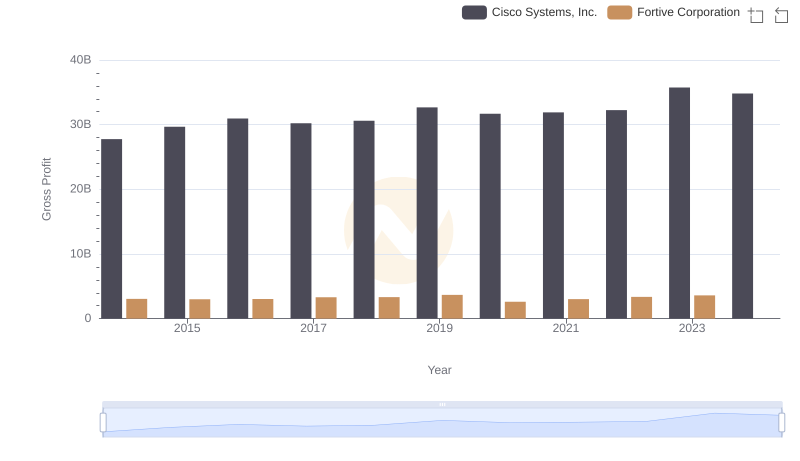
Key Insights on Gross Profit: Cisco Systems, Inc. vs Fortive Corporation
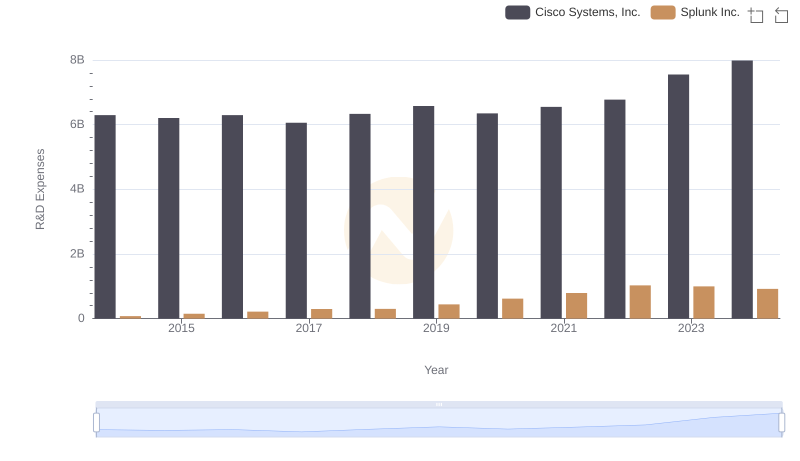
R&D Insights: How Cisco Systems, Inc. and Splunk Inc. Allocate Funds
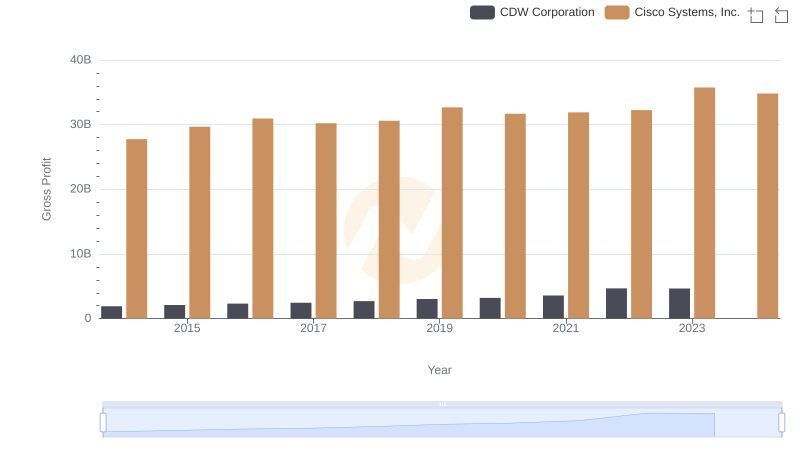
Cisco Systems, Inc. vs CDW Corporation: A Gross Profit Performance Breakdown
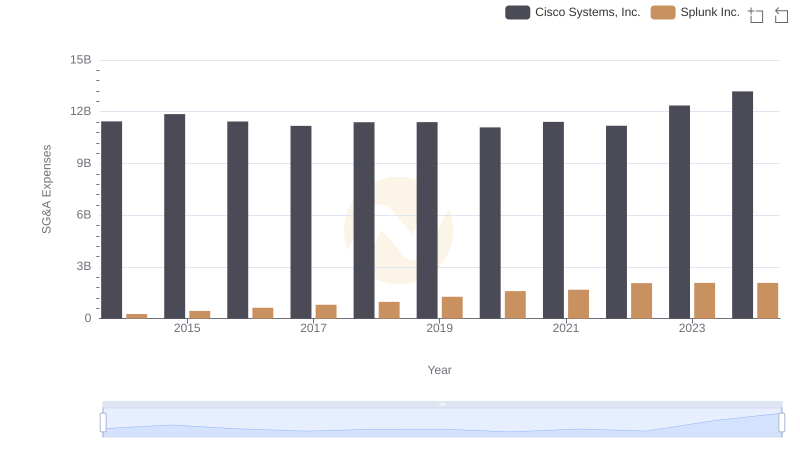
Comparing SG&A Expenses: Cisco Systems, Inc. vs Splunk Inc. Trends and Insights
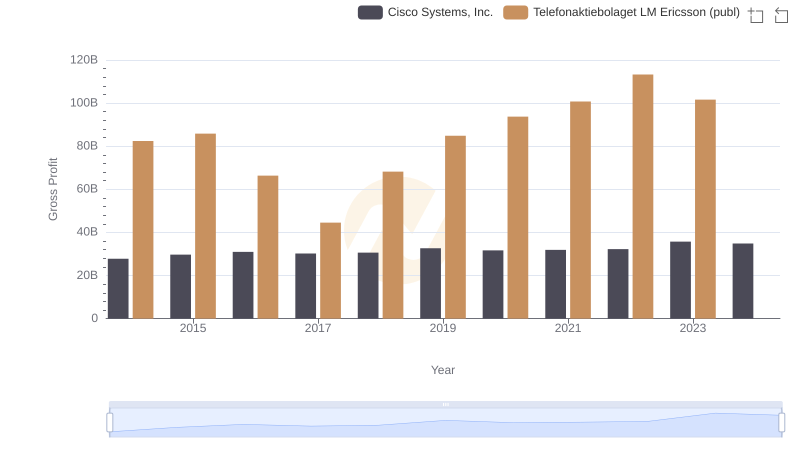
Cisco Systems, Inc. vs Telefonaktiebolaget LM Ericsson (publ): A Gross Profit Performance Breakdown
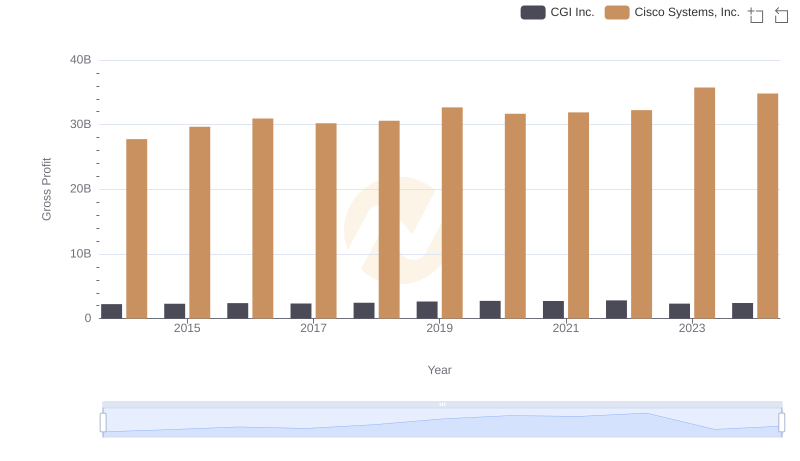
Key Insights on Gross Profit: Cisco Systems, Inc. vs CGI Inc.