| __timestamp | Broadridge Financial Solutions, Inc. | Cisco Systems, Inc. |
|---|---|---|
| Wednesday, January 1, 2014 | 1761400000 | 19373000000 |
| Thursday, January 1, 2015 | 1828200000 | 19480000000 |
| Friday, January 1, 2016 | 1975900000 | 18287000000 |
| Sunday, January 1, 2017 | 3109600000 | 17781000000 |
| Monday, January 1, 2018 | 3169600000 | 18724000000 |
| Tuesday, January 1, 2019 | 3131900000 | 19238000000 |
| Wednesday, January 1, 2020 | 3265100000 | 17618000000 |
| Friday, January 1, 2021 | 3570800000 | 17924000000 |
| Saturday, January 1, 2022 | 4116900000 | 19309000000 |
| Sunday, January 1, 2023 | 4275500000 | 21245000000 |
| Monday, January 1, 2024 | 4572900000 | 18975000000 |
Data in motion
In the ever-evolving landscape of technology and financial services, understanding the cost of revenue is crucial for evaluating a company's efficiency and profitability. Cisco Systems, Inc., a leader in networking technology, and Broadridge Financial Solutions, Inc., a key player in financial services, offer a fascinating comparison over the past decade.
From 2014 to 2024, Cisco's cost of revenue fluctuated, peaking in 2023 with a 10% increase from the previous year, before slightly declining in 2024. Meanwhile, Broadridge demonstrated a consistent upward trend, with a remarkable 160% increase over the same period. This growth reflects Broadridge's strategic investments and expansion in financial technology services.
The data reveals that while Cisco's cost management remains relatively stable, Broadridge's rising costs indicate aggressive growth strategies. Investors and analysts should consider these trends when evaluating the long-term potential and operational efficiency of these industry titans.
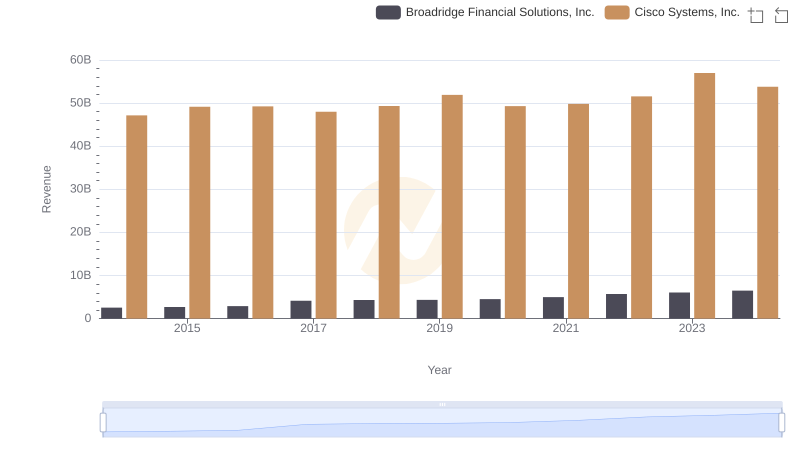
Cisco Systems, Inc. or Broadridge Financial Solutions, Inc.: Who Leads in Yearly Revenue?
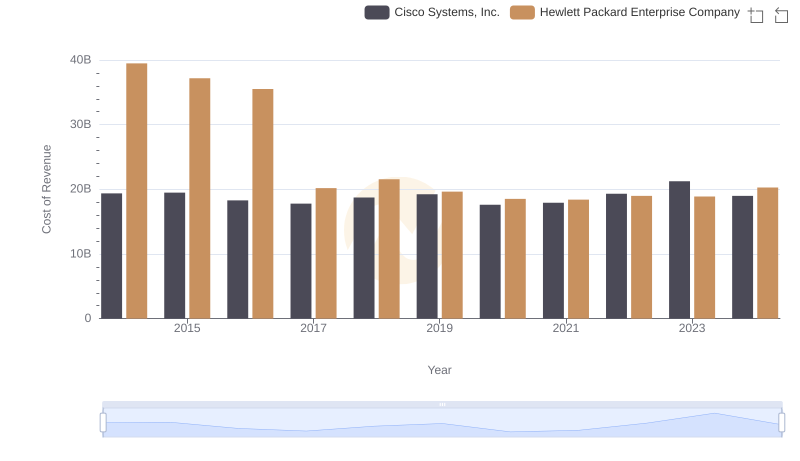
Cost of Revenue Comparison: Cisco Systems, Inc. vs Hewlett Packard Enterprise Company
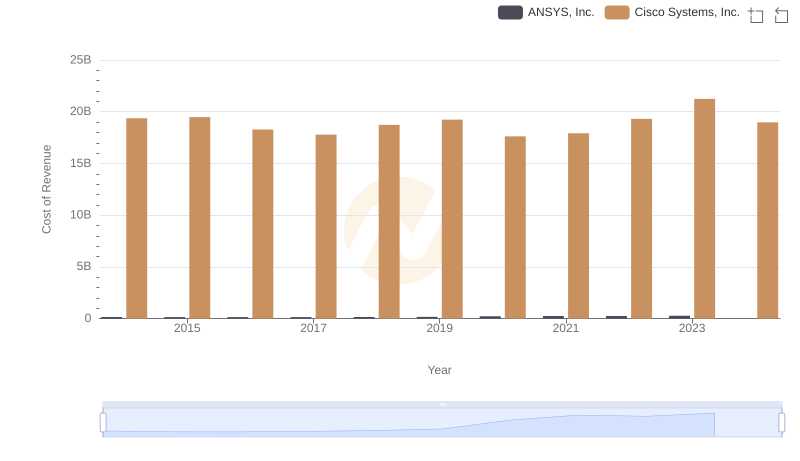
Cost of Revenue Trends: Cisco Systems, Inc. vs ANSYS, Inc.
Cost Insights: Breaking Down Cisco Systems, Inc. and II-VI Incorporated's Expenses
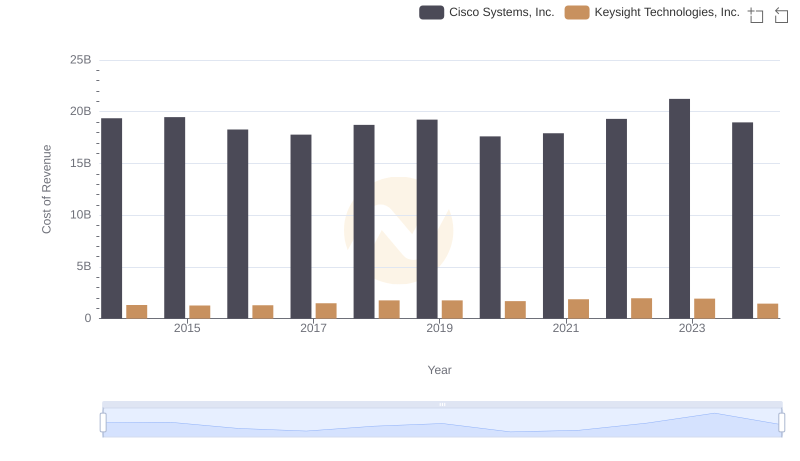
Cisco Systems, Inc. vs Keysight Technologies, Inc.: Efficiency in Cost of Revenue Explored
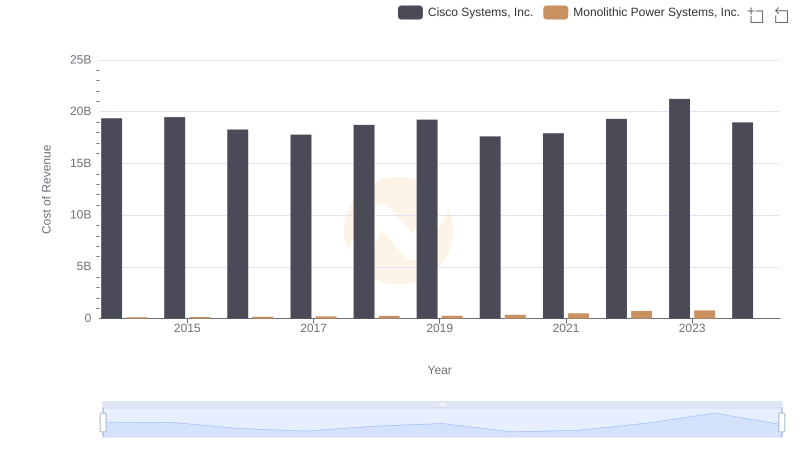
Comparing Cost of Revenue Efficiency: Cisco Systems, Inc. vs Monolithic Power Systems, Inc.
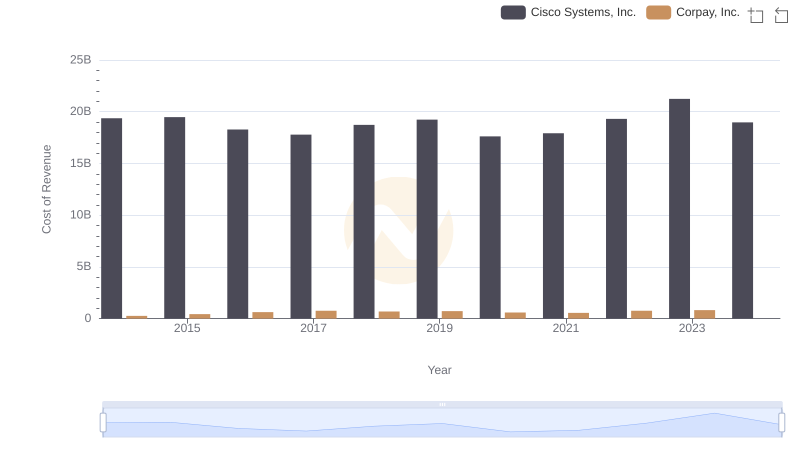
Cost of Revenue Comparison: Cisco Systems, Inc. vs Corpay, Inc.
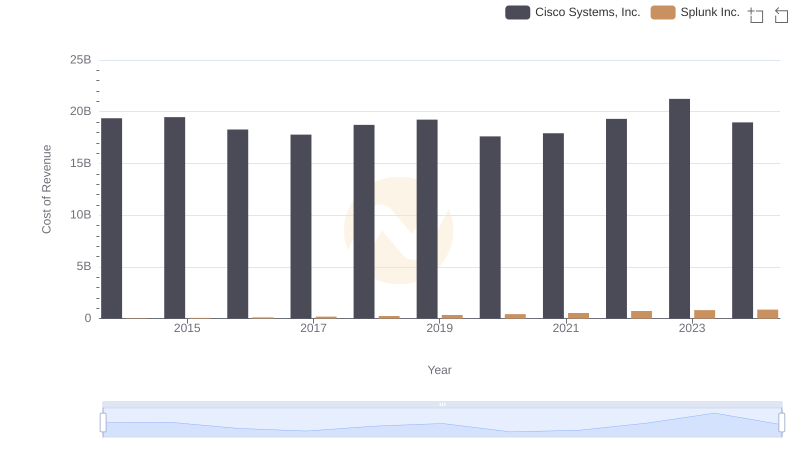
Analyzing Cost of Revenue: Cisco Systems, Inc. and Splunk Inc.
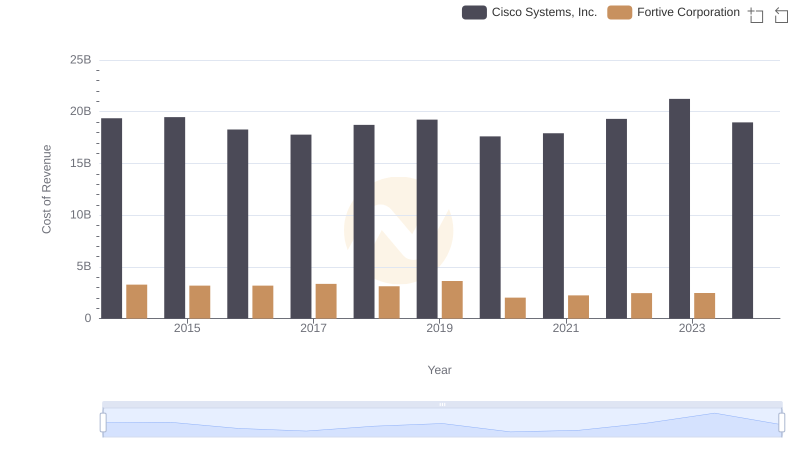
Comparing Cost of Revenue Efficiency: Cisco Systems, Inc. vs Fortive Corporation
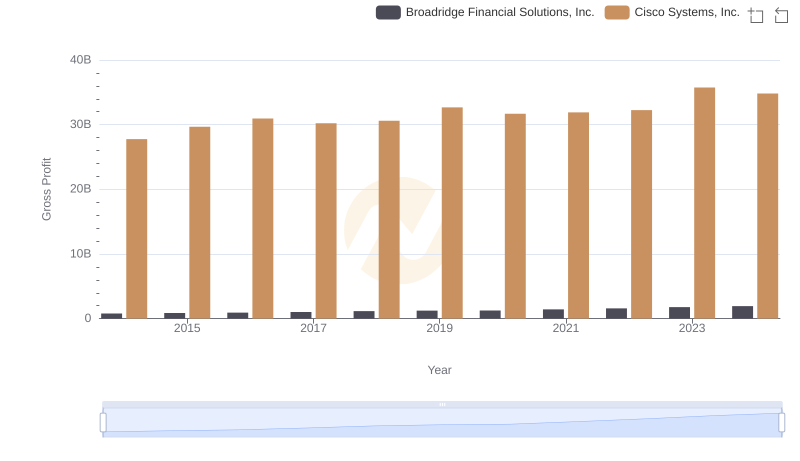
Gross Profit Comparison: Cisco Systems, Inc. and Broadridge Financial Solutions, Inc. Trends
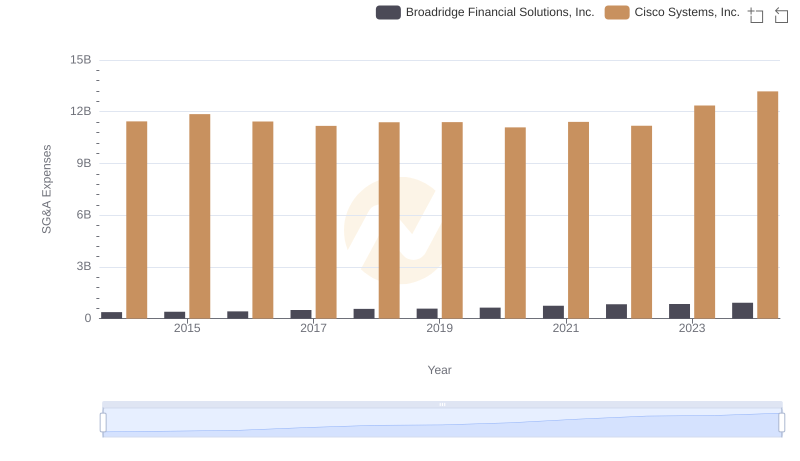
Breaking Down SG&A Expenses: Cisco Systems, Inc. vs Broadridge Financial Solutions, Inc.
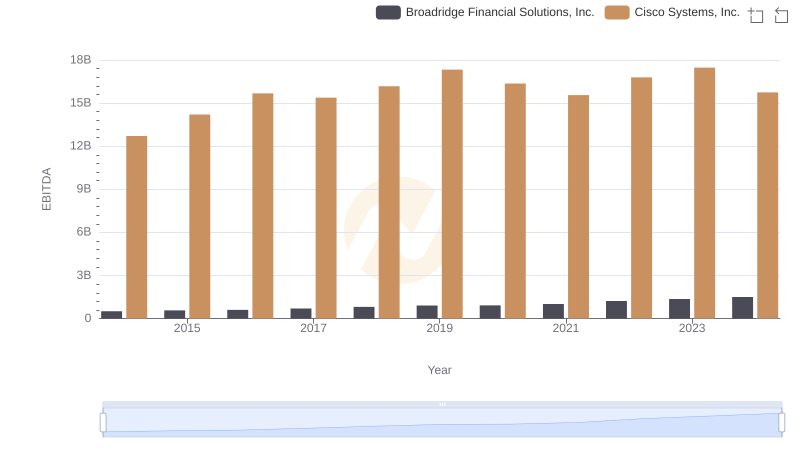
EBITDA Metrics Evaluated: Cisco Systems, Inc. vs Broadridge Financial Solutions, Inc.