| __timestamp | Cisco Systems, Inc. | Splunk Inc. |
|---|---|---|
| Wednesday, January 1, 2014 | 47142000000 | 302623000 |
| Thursday, January 1, 2015 | 49161000000 | 450875000 |
| Friday, January 1, 2016 | 49247000000 | 668435000 |
| Sunday, January 1, 2017 | 48005000000 | 949955000 |
| Monday, January 1, 2018 | 49330000000 | 1270788000 |
| Tuesday, January 1, 2019 | 51904000000 | 1803010000 |
| Wednesday, January 1, 2020 | 49301000000 | 2358926000 |
| Friday, January 1, 2021 | 49818000000 | 2229385000 |
| Saturday, January 1, 2022 | 51557000000 | 2673664000 |
| Sunday, January 1, 2023 | 56998000000 | 3653708000 |
| Monday, January 1, 2024 | 53803000000 | 4215595000 |
Unleashing insights
In the ever-evolving tech landscape, Cisco Systems, Inc. and Splunk Inc. have carved distinct paths over the past decade. Cisco, a stalwart in networking, has seen its annual revenue grow steadily, peaking at approximately $57 billion in 2023, a 21% increase from 2014. Meanwhile, Splunk, a leader in data analytics, has experienced a meteoric rise, with revenue surging over 1,300% from 2014 to 2024, reaching around $4.2 billion.
Cisco's growth reflects its robust market position and strategic acquisitions, while Splunk's rapid ascent underscores the increasing demand for data-driven insights. Despite their different trajectories, both companies exemplify resilience and innovation in the tech industry. As we look to the future, the question remains: how will these giants adapt to the next wave of technological advancements?
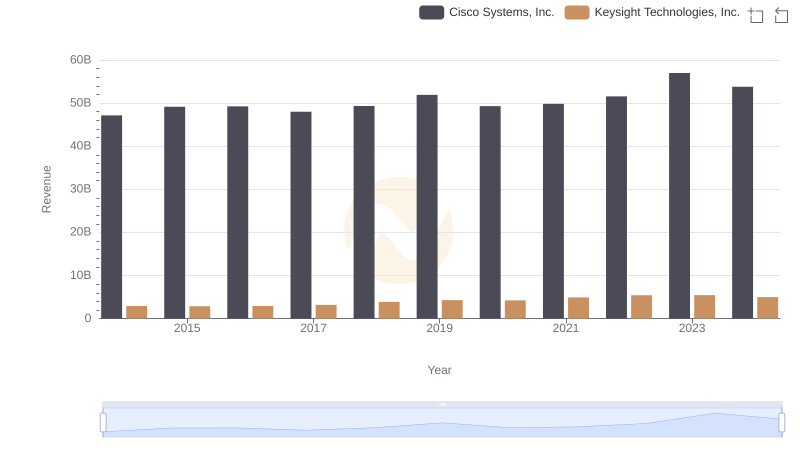
Cisco Systems, Inc. and Keysight Technologies, Inc.: A Comprehensive Revenue Analysis
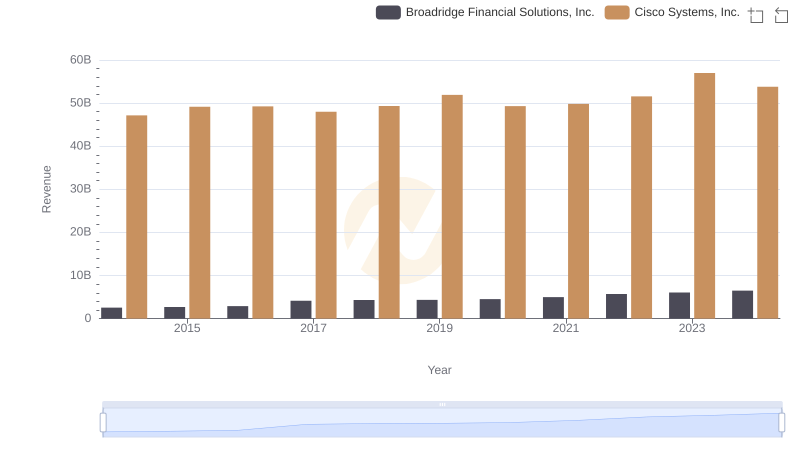
Cisco Systems, Inc. or Broadridge Financial Solutions, Inc.: Who Leads in Yearly Revenue?
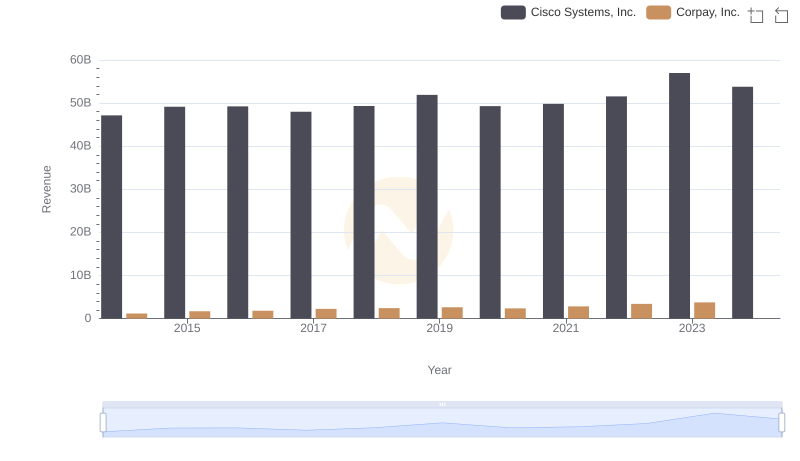
Revenue Showdown: Cisco Systems, Inc. vs Corpay, Inc.
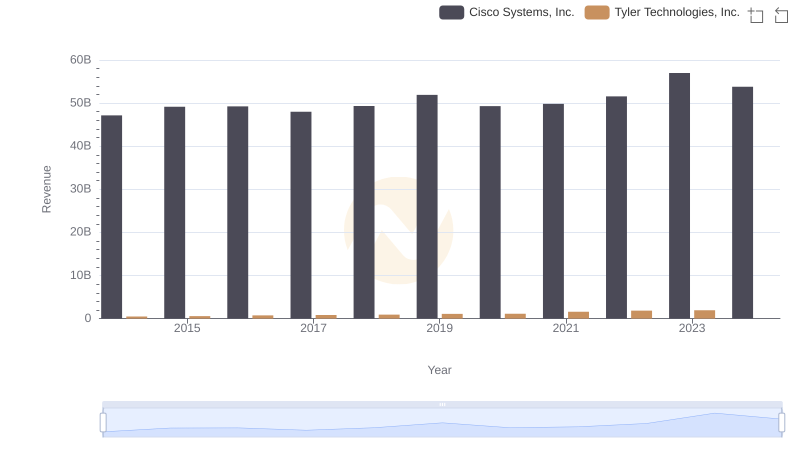
Cisco Systems, Inc. vs Tyler Technologies, Inc.: Annual Revenue Growth Compared
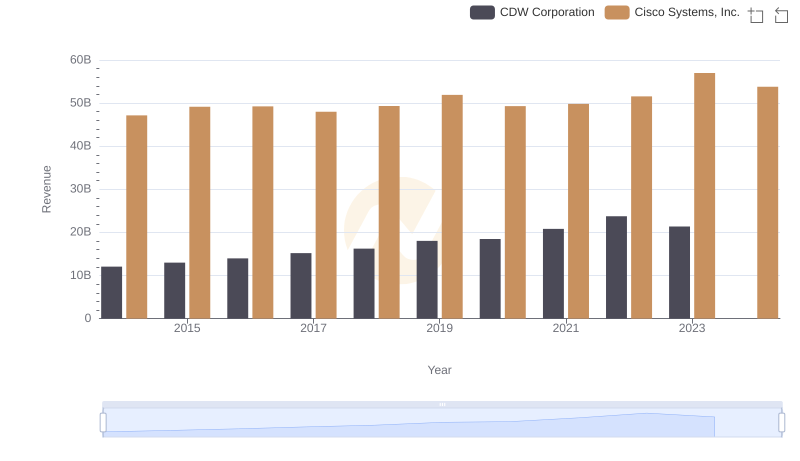
Cisco Systems, Inc. vs CDW Corporation: Annual Revenue Growth Compared
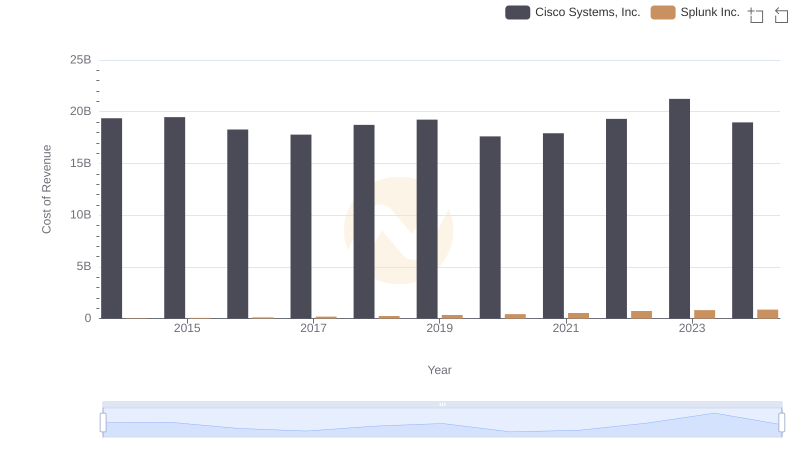
Analyzing Cost of Revenue: Cisco Systems, Inc. and Splunk Inc.

Cisco Systems, Inc. vs Telefonaktiebolaget LM Ericsson (publ): Examining Key Revenue Metrics
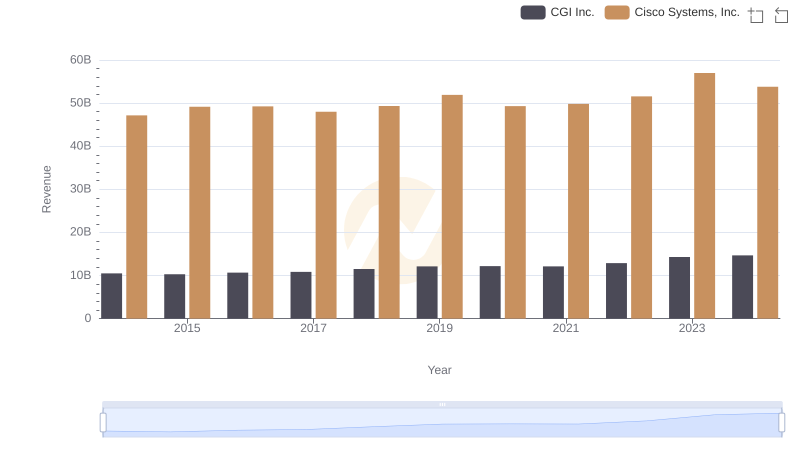
Revenue Insights: Cisco Systems, Inc. and CGI Inc. Performance Compared
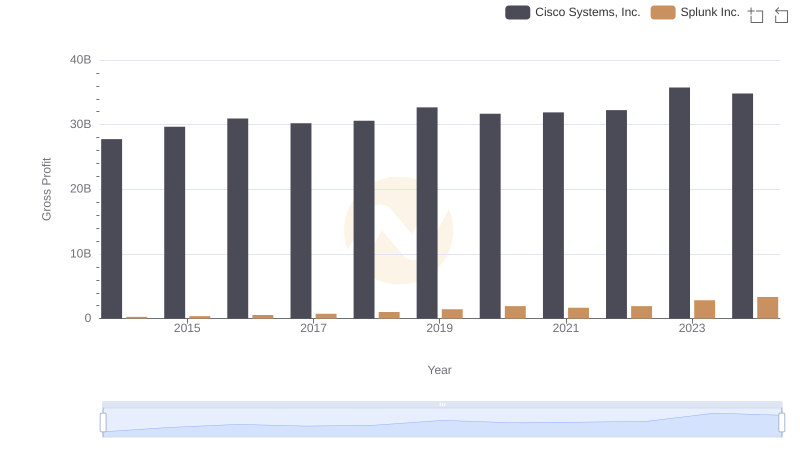
Gross Profit Comparison: Cisco Systems, Inc. and Splunk Inc. Trends
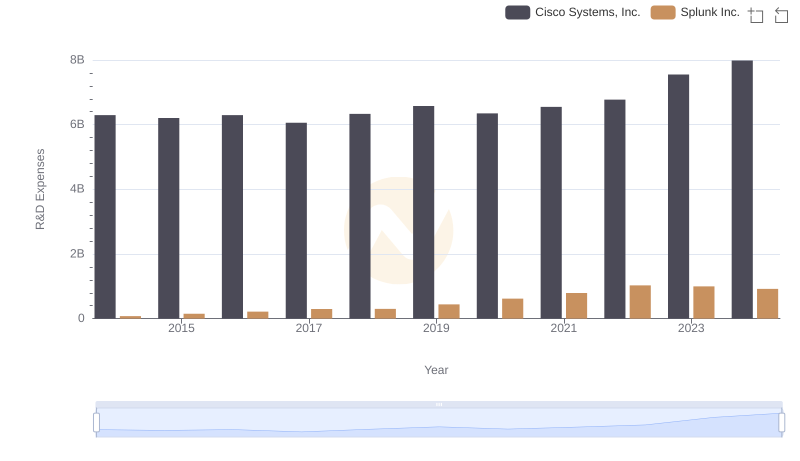
R&D Insights: How Cisco Systems, Inc. and Splunk Inc. Allocate Funds
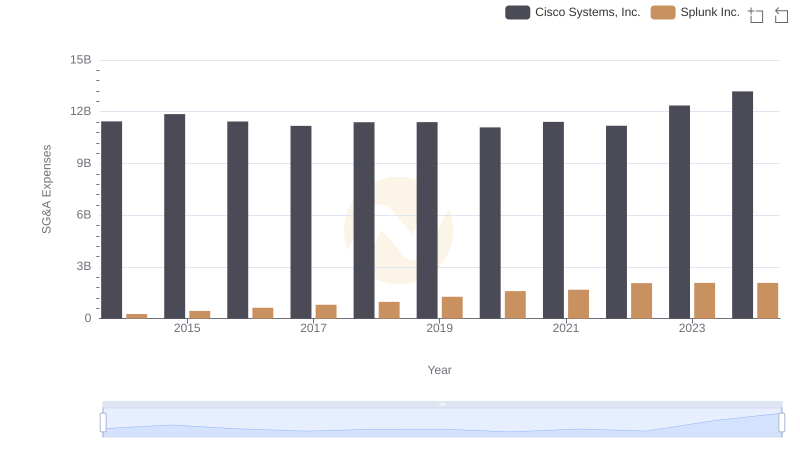
Comparing SG&A Expenses: Cisco Systems, Inc. vs Splunk Inc. Trends and Insights