| __timestamp | Cisco Systems, Inc. | Splunk Inc. |
|---|---|---|
| Wednesday, January 1, 2014 | 11437000000 | 269210000 |
| Thursday, January 1, 2015 | 11861000000 | 447517000 |
| Friday, January 1, 2016 | 11433000000 | 626927000 |
| Sunday, January 1, 2017 | 11177000000 | 806883000 |
| Monday, January 1, 2018 | 11386000000 | 967560000 |
| Tuesday, January 1, 2019 | 11398000000 | 1267538000 |
| Wednesday, January 1, 2020 | 11094000000 | 1596475000 |
| Friday, January 1, 2021 | 11411000000 | 1671200000 |
| Saturday, January 1, 2022 | 11186000000 | 2056950000 |
| Sunday, January 1, 2023 | 12358000000 | 2076049000 |
| Monday, January 1, 2024 | 13177000000 | 2074630000 |
Data in motion
In the ever-evolving tech industry, understanding financial trends is crucial. Over the past decade, Cisco Systems, Inc. and Splunk Inc. have shown distinct trajectories in their Selling, General, and Administrative (SG&A) expenses. Cisco, a stalwart in networking, consistently maintained high SG&A expenses, peaking at approximately $13.2 billion in 2024, reflecting a steady growth of around 15% from 2014. In contrast, Splunk, a leader in data analytics, exhibited a more dynamic increase, with SG&A expenses surging by over 670% from 2014 to 2024, reaching about $2.1 billion. This stark contrast highlights Cisco's stable operational scale and Splunk's aggressive expansion strategy. As the tech landscape continues to shift, these trends offer valuable insights into each company's strategic priorities and market positioning.
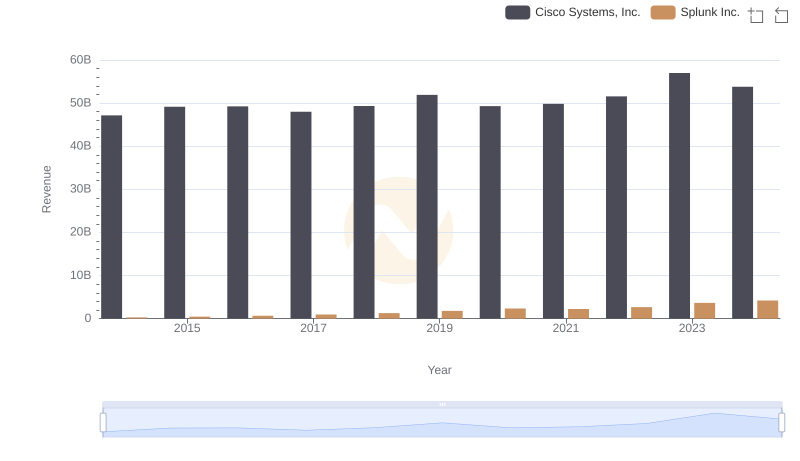
Cisco Systems, Inc. vs Splunk Inc.: Annual Revenue Growth Compared
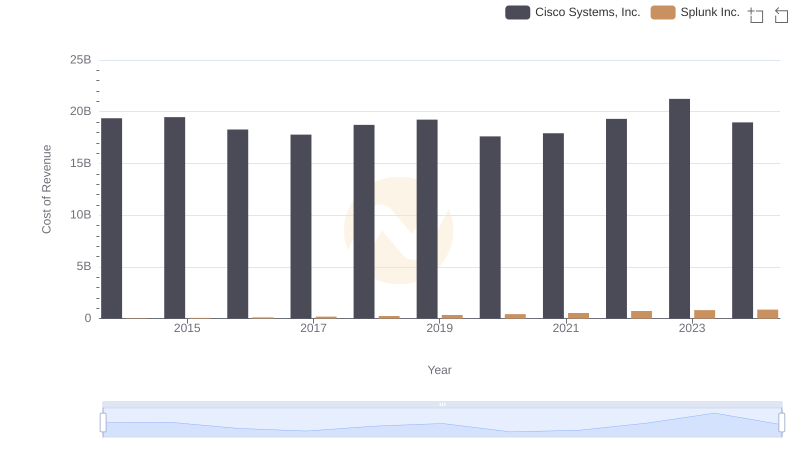
Analyzing Cost of Revenue: Cisco Systems, Inc. and Splunk Inc.
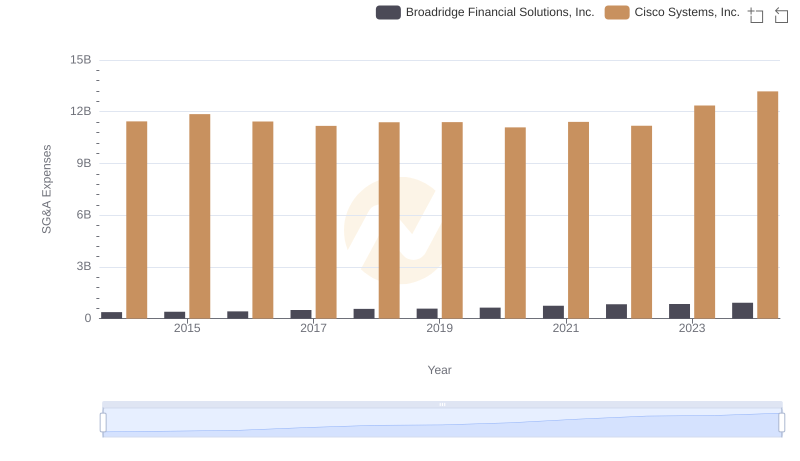
Breaking Down SG&A Expenses: Cisco Systems, Inc. vs Broadridge Financial Solutions, Inc.
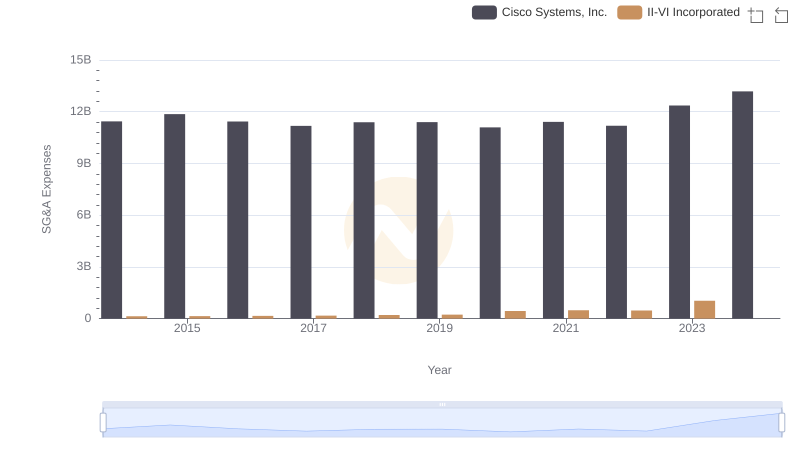
Operational Costs Compared: SG&A Analysis of Cisco Systems, Inc. and II-VI Incorporated
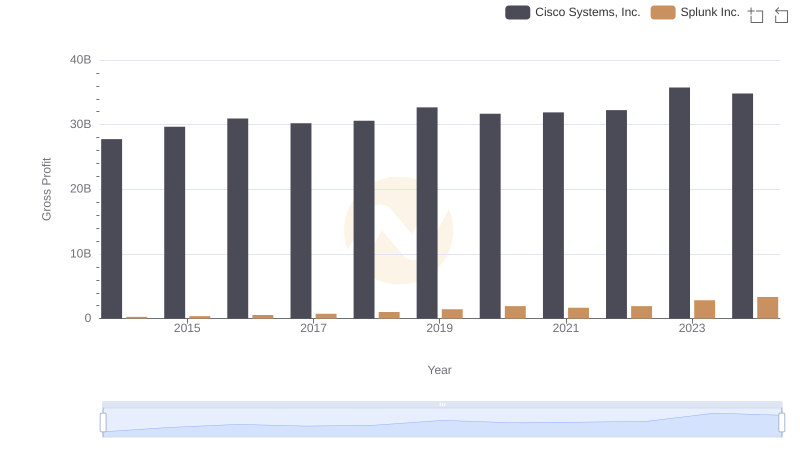
Gross Profit Comparison: Cisco Systems, Inc. and Splunk Inc. Trends
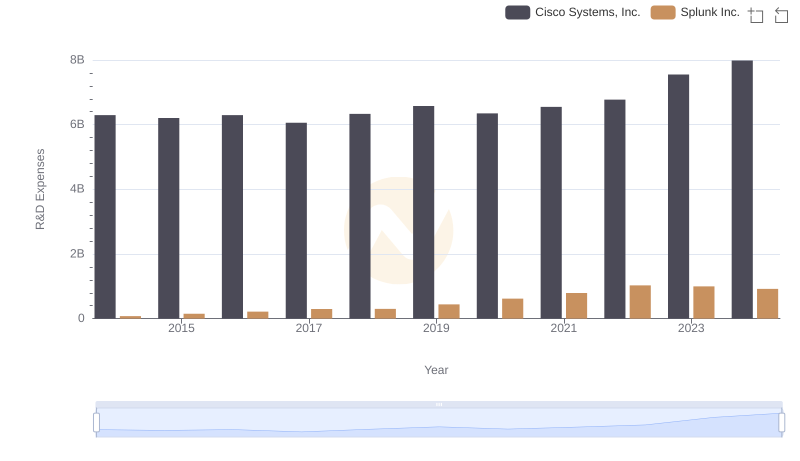
R&D Insights: How Cisco Systems, Inc. and Splunk Inc. Allocate Funds
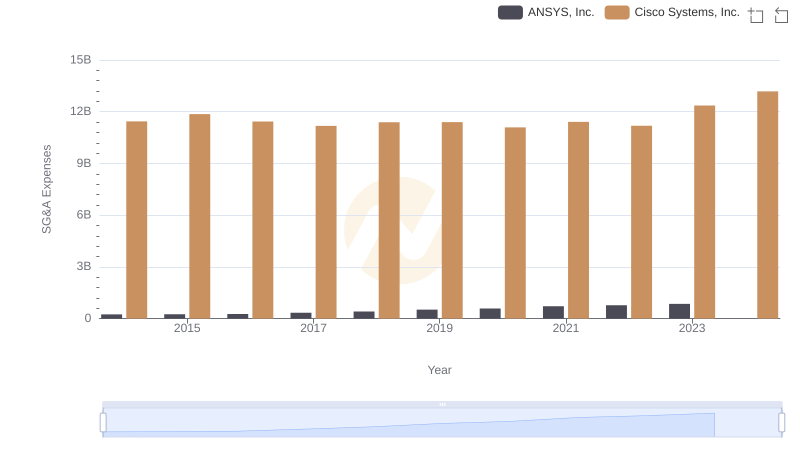
Cisco Systems, Inc. vs ANSYS, Inc.: SG&A Expense Trends
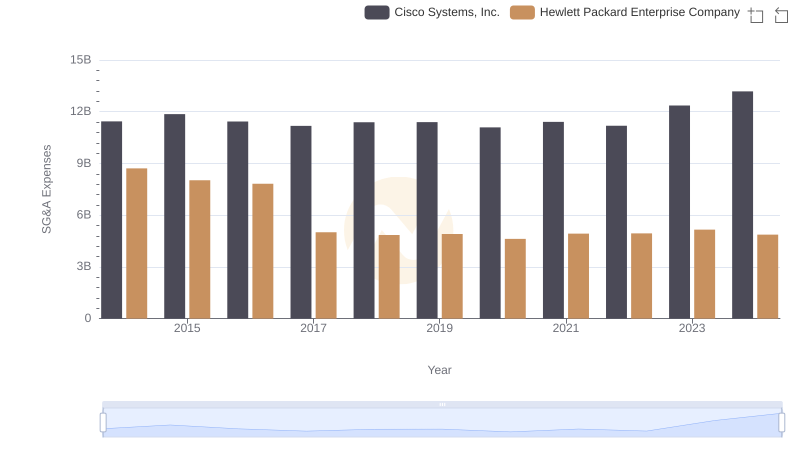
Comparing SG&A Expenses: Cisco Systems, Inc. vs Hewlett Packard Enterprise Company Trends and Insights
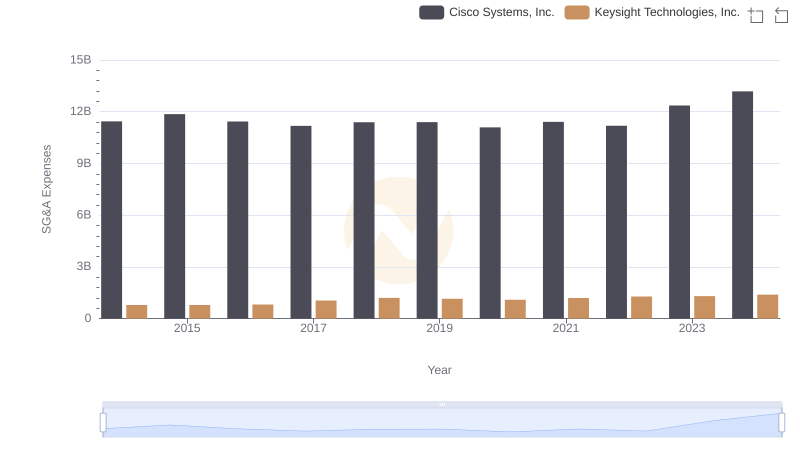
Cost Management Insights: SG&A Expenses for Cisco Systems, Inc. and Keysight Technologies, Inc.
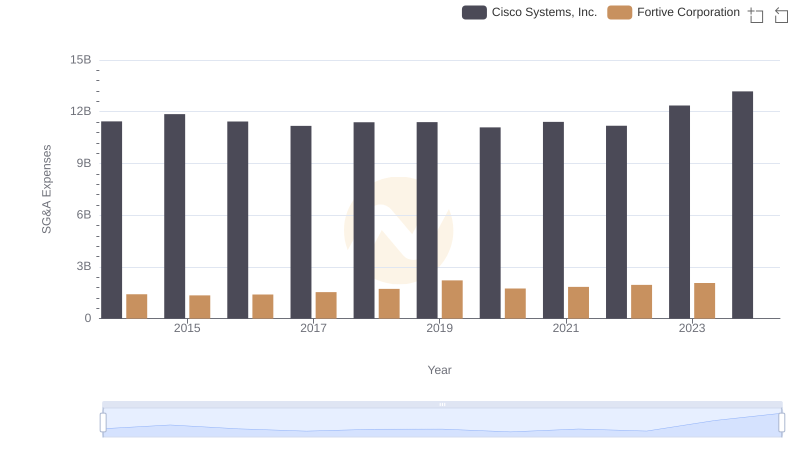
Operational Costs Compared: SG&A Analysis of Cisco Systems, Inc. and Fortive Corporation
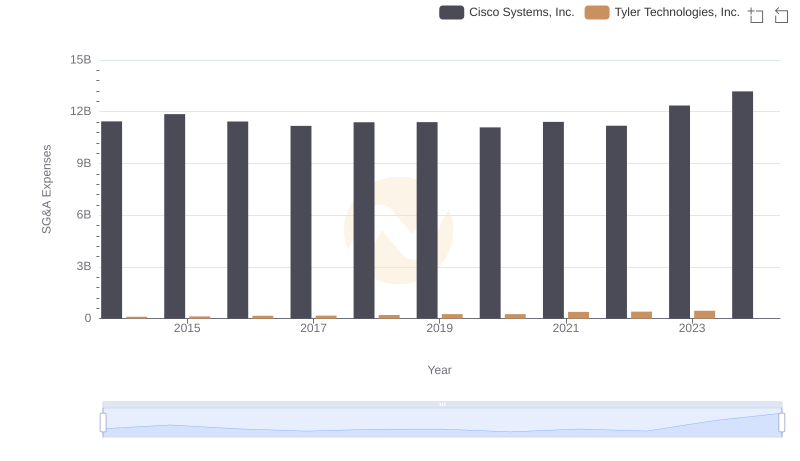
Breaking Down SG&A Expenses: Cisco Systems, Inc. vs Tyler Technologies, Inc.
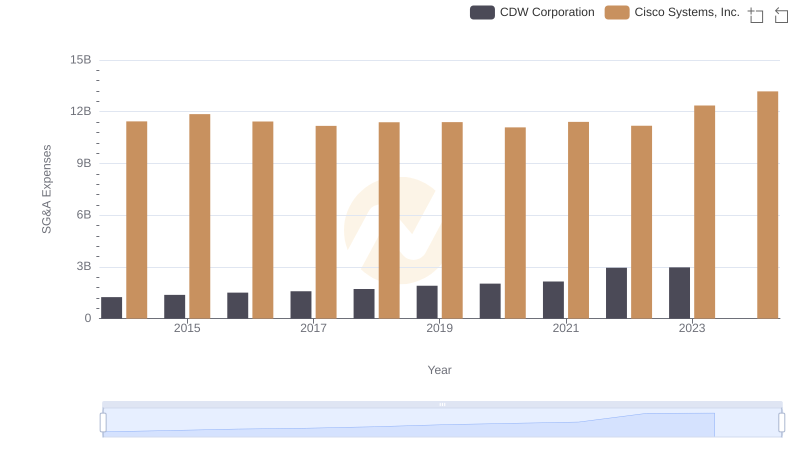
Cisco Systems, Inc. or CDW Corporation: Who Manages SG&A Costs Better?