| __timestamp | Cisco Systems, Inc. | Splunk Inc. |
|---|---|---|
| Wednesday, January 1, 2014 | 6294000000 | 75895000 |
| Thursday, January 1, 2015 | 6207000000 | 150790000 |
| Friday, January 1, 2016 | 6296000000 | 215309000 |
| Sunday, January 1, 2017 | 6059000000 | 295850000 |
| Monday, January 1, 2018 | 6332000000 | 301114000 |
| Tuesday, January 1, 2019 | 6577000000 | 441969000 |
| Wednesday, January 1, 2020 | 6347000000 | 619800000 |
| Friday, January 1, 2021 | 6549000000 | 791026000 |
| Saturday, January 1, 2022 | 6774000000 | 1029574000 |
| Sunday, January 1, 2023 | 7551000000 | 997170000 |
| Monday, January 1, 2024 | 7983000000 | 918834000 |
Data in motion
In the ever-evolving tech landscape, research and development (R&D) is the lifeblood of innovation. Cisco Systems, Inc. and Splunk Inc. exemplify this commitment, albeit on different scales. From 2014 to 2024, Cisco's R&D expenses have surged by approximately 27%, reflecting its robust investment in future technologies. In 2023 alone, Cisco allocated nearly 7.6 billion dollars, a testament to its strategic focus on maintaining a competitive edge.
Conversely, Splunk Inc., a leader in data analytics, has shown a remarkable growth trajectory in its R&D spending, increasing by over 1,200% since 2014. By 2022, Splunk's R&D expenses reached over 1 billion dollars, underscoring its dedication to enhancing its data solutions. This stark contrast in R&D allocation highlights the diverse strategies of these tech titans, each carving its path in the digital age.
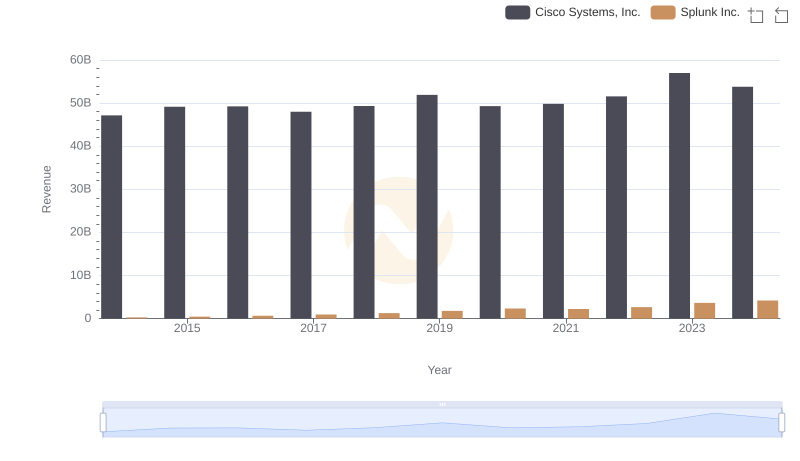
Cisco Systems, Inc. vs Splunk Inc.: Annual Revenue Growth Compared
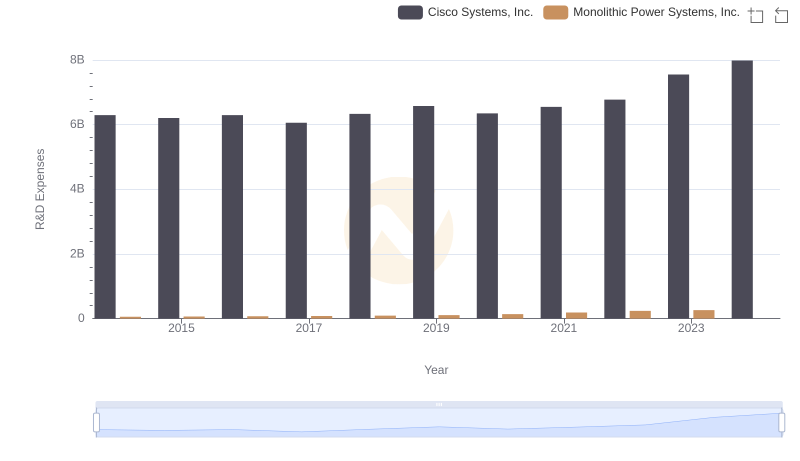
Cisco Systems, Inc. vs Monolithic Power Systems, Inc.: Strategic Focus on R&D Spending
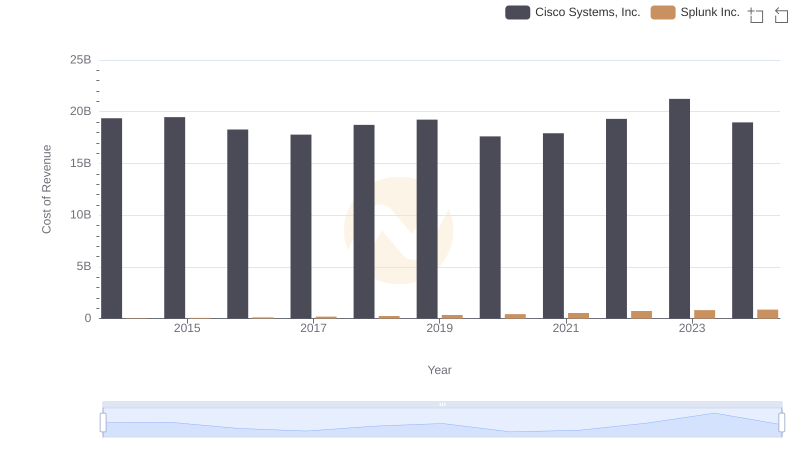
Analyzing Cost of Revenue: Cisco Systems, Inc. and Splunk Inc.
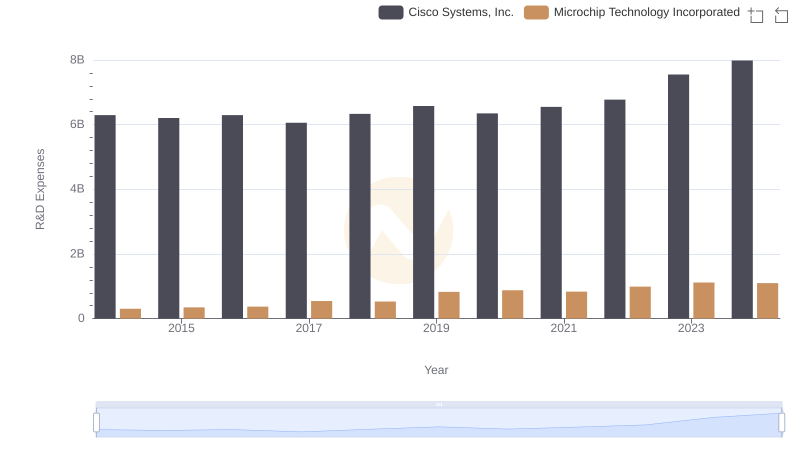
Analyzing R&D Budgets: Cisco Systems, Inc. vs Microchip Technology Incorporated
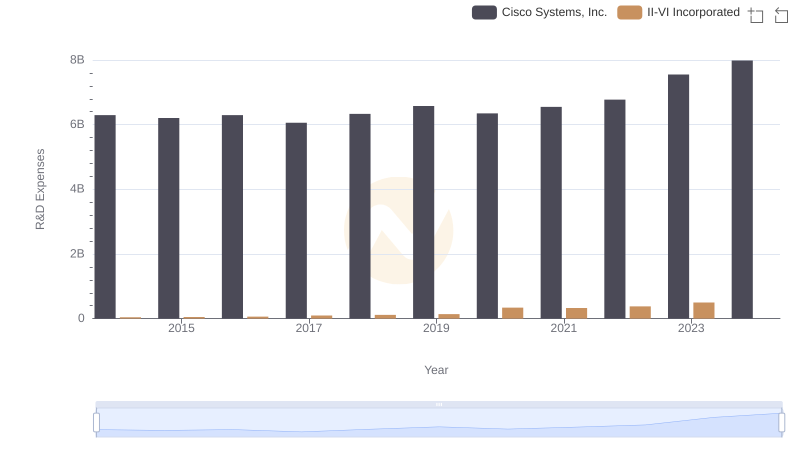
Research and Development Expenses Breakdown: Cisco Systems, Inc. vs II-VI Incorporated
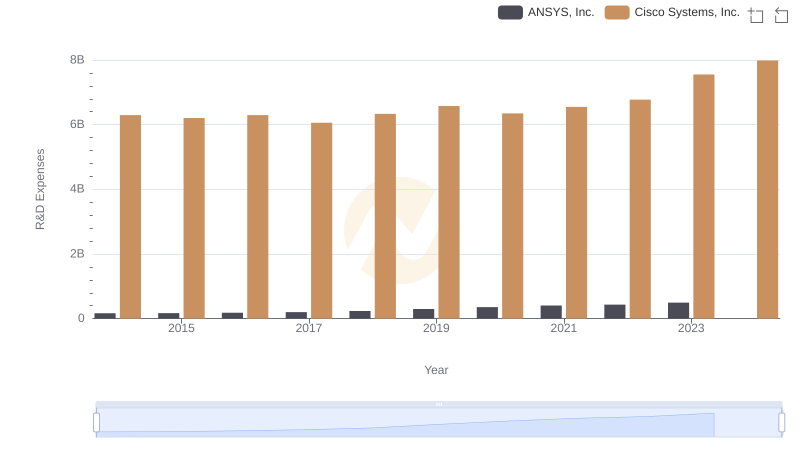
Comparing Innovation Spending: Cisco Systems, Inc. and ANSYS, Inc.
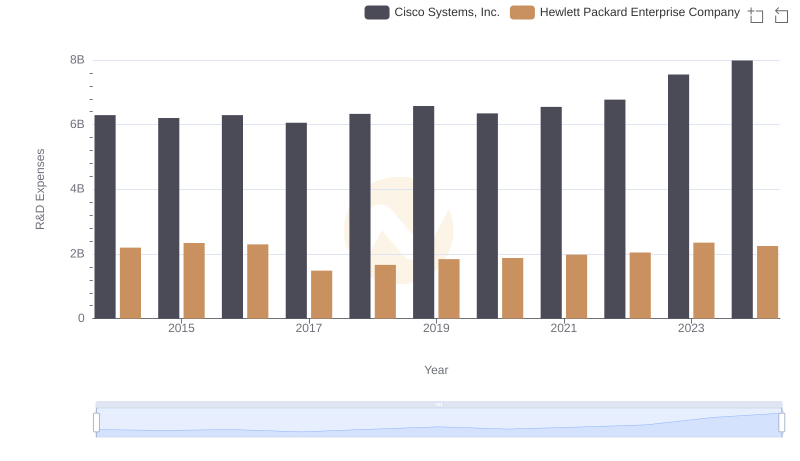
R&D Spending Showdown: Cisco Systems, Inc. vs Hewlett Packard Enterprise Company
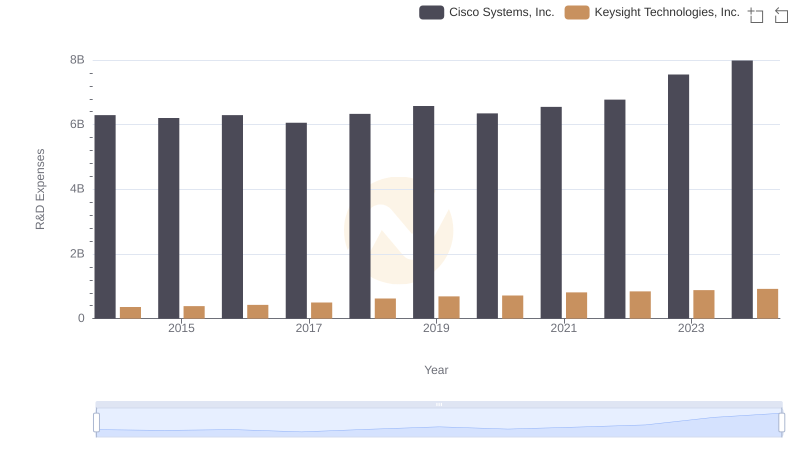
Research and Development Expenses Breakdown: Cisco Systems, Inc. vs Keysight Technologies, Inc.
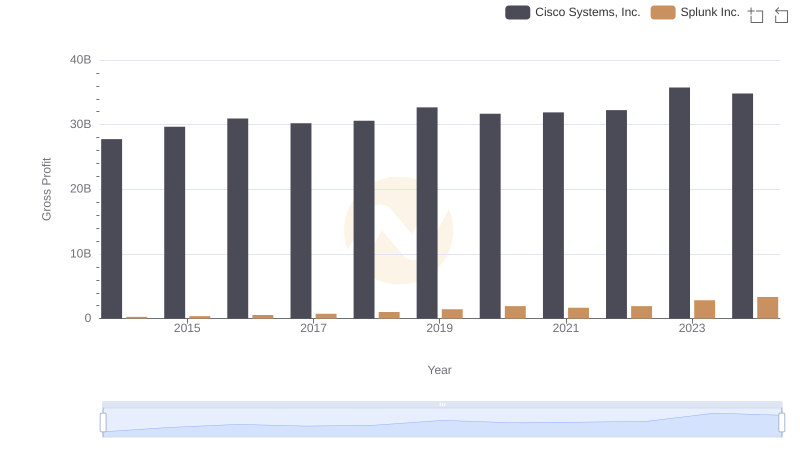
Gross Profit Comparison: Cisco Systems, Inc. and Splunk Inc. Trends
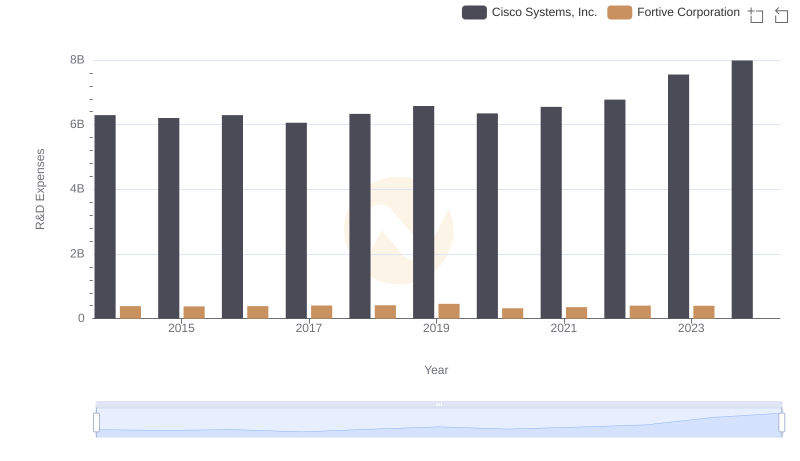
Who Prioritizes Innovation? R&D Spending Compared for Cisco Systems, Inc. and Fortive Corporation
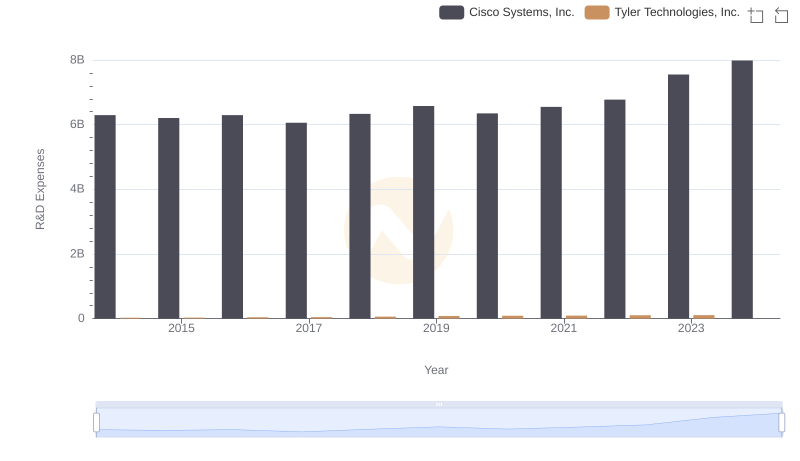
Analyzing R&D Budgets: Cisco Systems, Inc. vs Tyler Technologies, Inc.
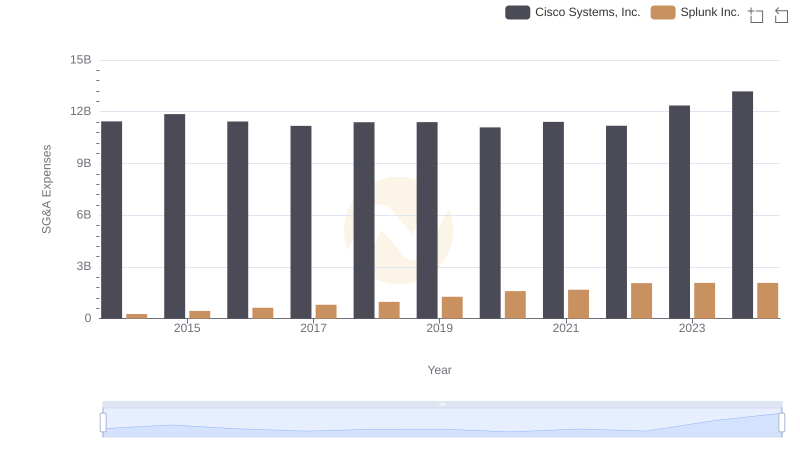
Comparing SG&A Expenses: Cisco Systems, Inc. vs Splunk Inc. Trends and Insights