| __timestamp | Cisco Systems, Inc. | II-VI Incorporated |
|---|---|---|
| Wednesday, January 1, 2014 | 19373000000 | 456545000 |
| Thursday, January 1, 2015 | 19480000000 | 470363000 |
| Friday, January 1, 2016 | 18287000000 | 514403000 |
| Sunday, January 1, 2017 | 17781000000 | 583693000 |
| Monday, January 1, 2018 | 18724000000 | 696591000 |
| Tuesday, January 1, 2019 | 19238000000 | 841147000 |
| Wednesday, January 1, 2020 | 17618000000 | 1560521000 |
| Friday, January 1, 2021 | 17924000000 | 1889678000 |
| Saturday, January 1, 2022 | 19309000000 | 2051120000 |
| Sunday, January 1, 2023 | 21245000000 | 3541817000 |
| Monday, January 1, 2024 | 18975000000 | 3251724000 |
Unleashing the power of data
In the ever-evolving tech industry, understanding cost structures is crucial for investors and analysts alike. Cisco Systems, Inc., a stalwart in networking technology, and II-VI Incorporated, a leader in engineered materials, offer intriguing insights into their financial strategies over the past decade. From 2014 to 2023, Cisco's cost of revenue has shown a steady trend, peaking in 2023 with a 10% increase from its 2014 figures. In contrast, II-VI Incorporated has experienced a dramatic rise, with its cost of revenue surging by over 670% during the same period, reflecting its aggressive expansion and acquisition strategies. Notably, 2023 marked a significant year for II-VI, with costs reaching their highest point, indicating a potential shift in operational focus. As we look to 2024, Cisco's data remains consistent, while II-VI's absence of data suggests a period of transition or restructuring.
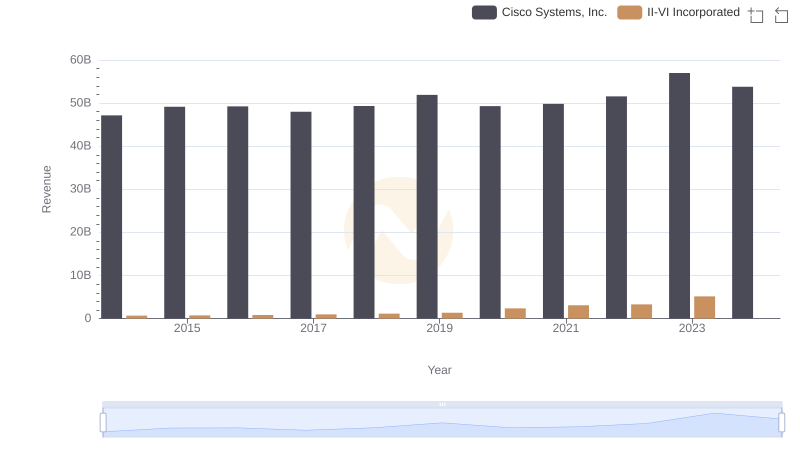
Who Generates More Revenue? Cisco Systems, Inc. or II-VI Incorporated
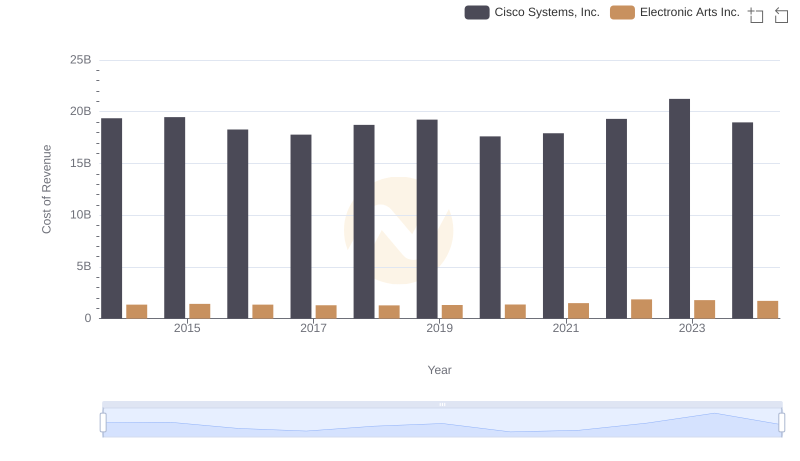
Cost of Revenue: Key Insights for Cisco Systems, Inc. and Electronic Arts Inc.
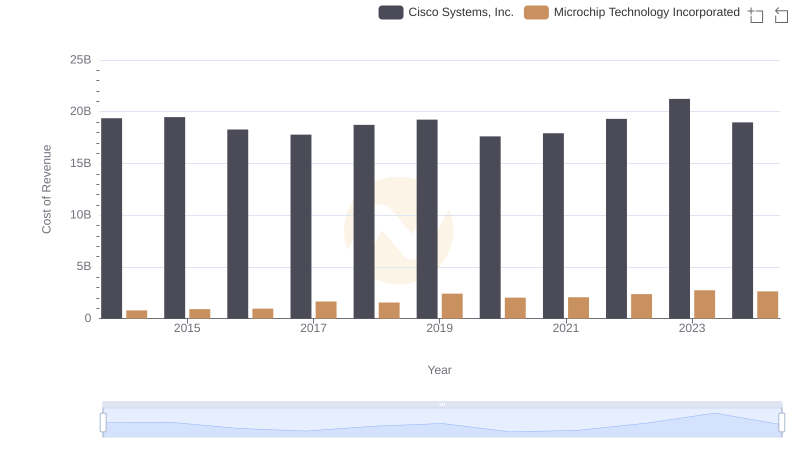
Analyzing Cost of Revenue: Cisco Systems, Inc. and Microchip Technology Incorporated
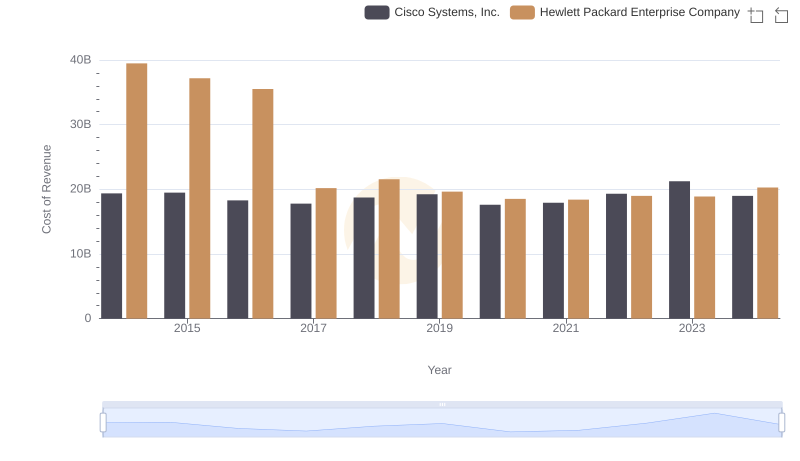
Cost of Revenue Comparison: Cisco Systems, Inc. vs Hewlett Packard Enterprise Company
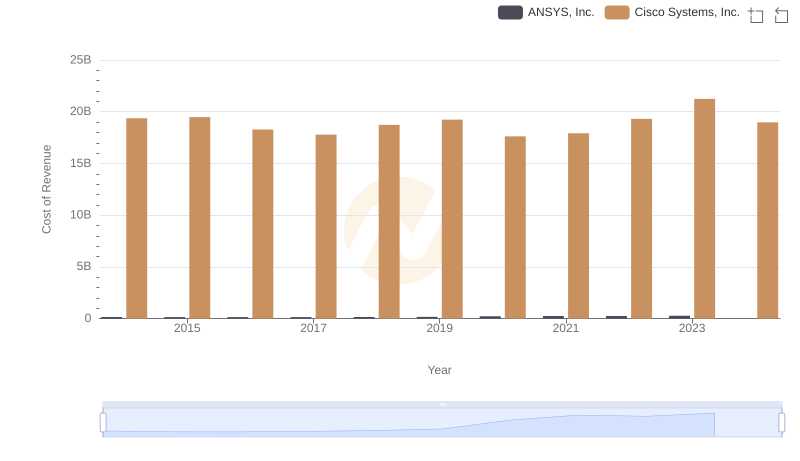
Cost of Revenue Trends: Cisco Systems, Inc. vs ANSYS, Inc.
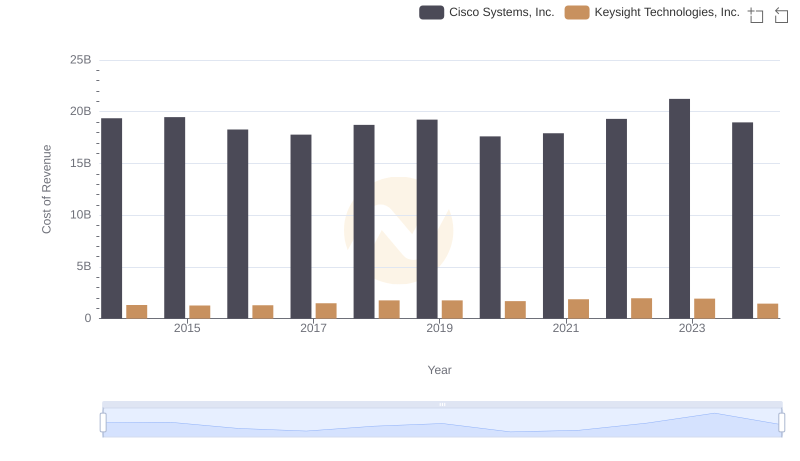
Cisco Systems, Inc. vs Keysight Technologies, Inc.: Efficiency in Cost of Revenue Explored
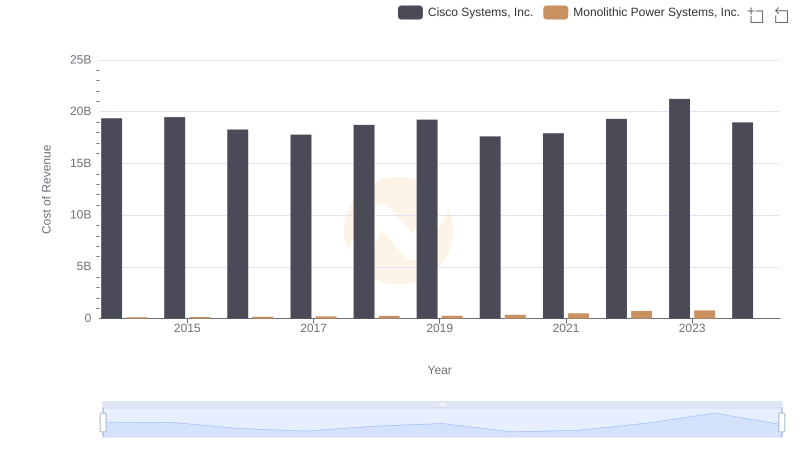
Comparing Cost of Revenue Efficiency: Cisco Systems, Inc. vs Monolithic Power Systems, Inc.
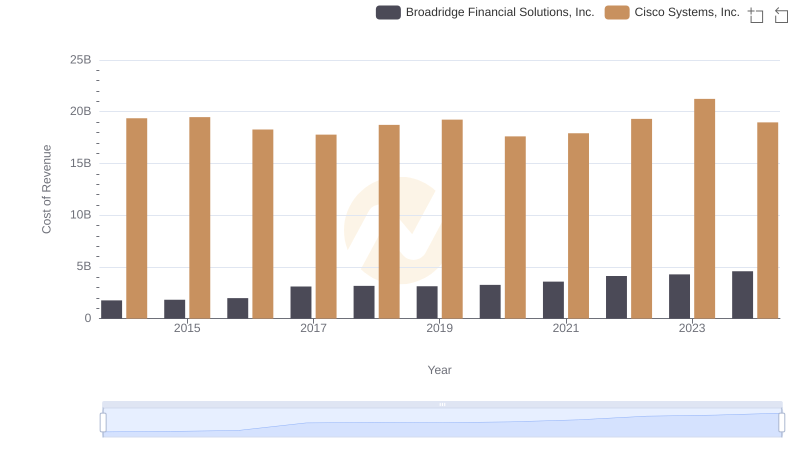
Analyzing Cost of Revenue: Cisco Systems, Inc. and Broadridge Financial Solutions, Inc.
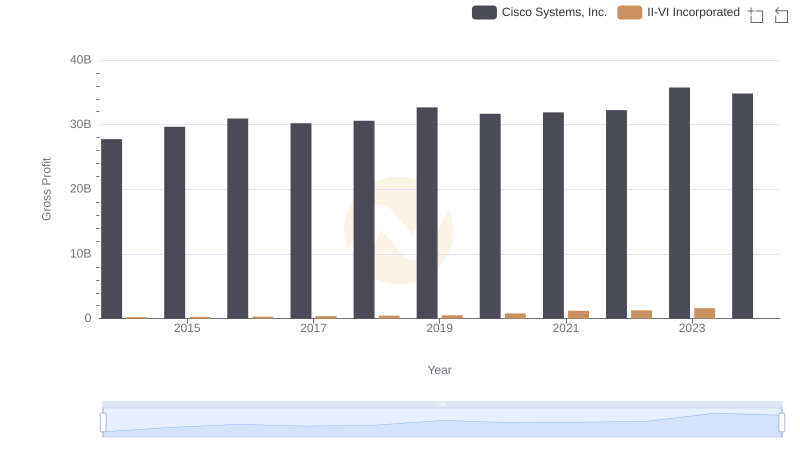
Gross Profit Analysis: Comparing Cisco Systems, Inc. and II-VI Incorporated
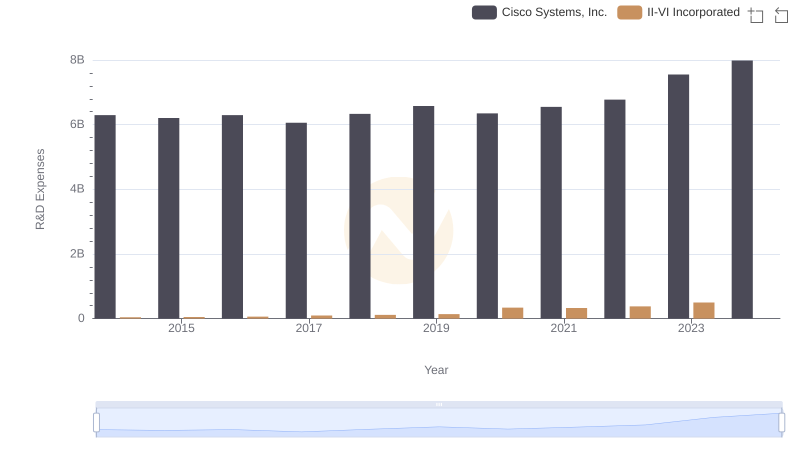
Research and Development Expenses Breakdown: Cisco Systems, Inc. vs II-VI Incorporated
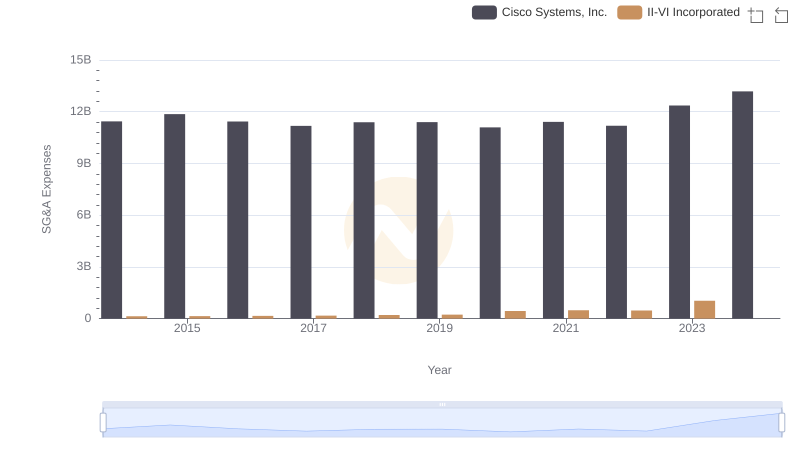
Operational Costs Compared: SG&A Analysis of Cisco Systems, Inc. and II-VI Incorporated
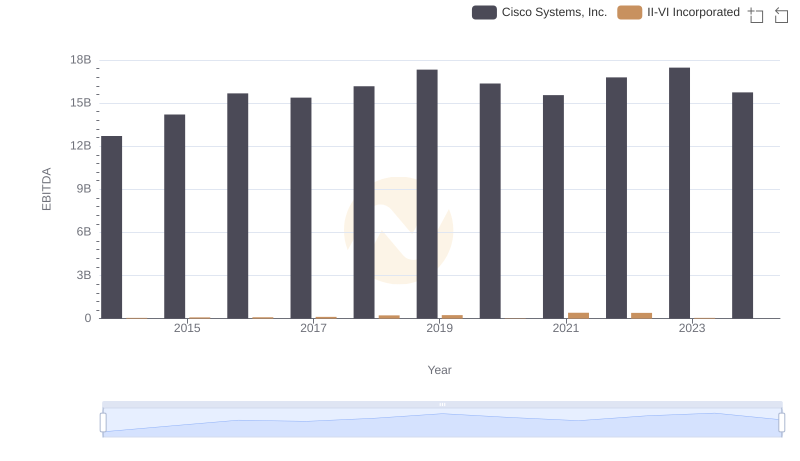
EBITDA Performance Review: Cisco Systems, Inc. vs II-VI Incorporated