| __timestamp | Cisco Systems, Inc. | Monolithic Power Systems, Inc. |
|---|---|---|
| Wednesday, January 1, 2014 | 19373000000 | 129917000 |
| Thursday, January 1, 2015 | 19480000000 | 152898000 |
| Friday, January 1, 2016 | 18287000000 | 177792000 |
| Sunday, January 1, 2017 | 17781000000 | 212646000 |
| Monday, January 1, 2018 | 18724000000 | 259714000 |
| Tuesday, January 1, 2019 | 19238000000 | 281596000 |
| Wednesday, January 1, 2020 | 17618000000 | 378498000 |
| Friday, January 1, 2021 | 17924000000 | 522339000 |
| Saturday, January 1, 2022 | 19309000000 | 745596000 |
| Sunday, January 1, 2023 | 21245000000 | 799953000 |
| Monday, January 1, 2024 | 18975000000 |
Unveiling the hidden dimensions of data
In the ever-evolving tech landscape, cost efficiency is a critical metric for success. From 2014 to 2023, Cisco Systems, Inc. and Monolithic Power Systems, Inc. have showcased contrasting trajectories in their cost of revenue. Cisco, a stalwart in networking, maintained a relatively stable cost of revenue, peaking in 2023 with a 10% increase from 2014. Meanwhile, Monolithic Power Systems, a leader in power solutions, demonstrated a remarkable growth story. Their cost of revenue surged by over 500% during the same period, reflecting their aggressive expansion and market penetration.
While Cisco's cost efficiency remained consistent, Monolithic Power's rapid growth highlights its dynamic approach in a competitive market. However, data for 2024 is missing for Monolithic Power, leaving room for speculation on their future strategy. This comparison underscores the diverse strategies tech companies employ to navigate financial landscapes.

Who Generates More Revenue? Cisco Systems, Inc. or Monolithic Power Systems, Inc.
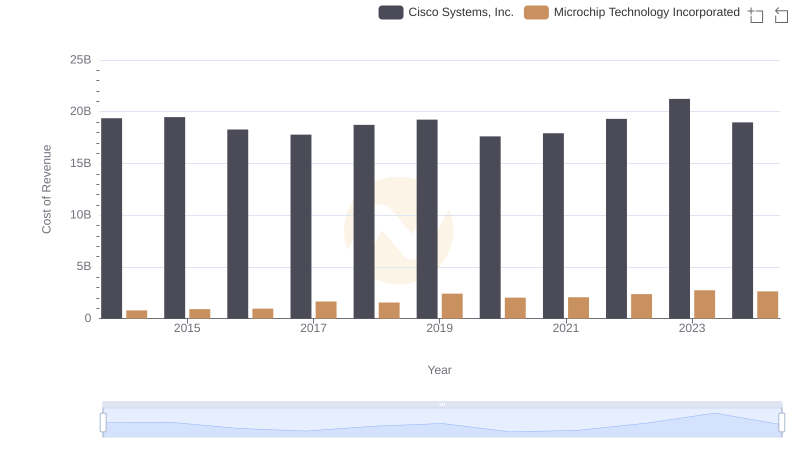
Analyzing Cost of Revenue: Cisco Systems, Inc. and Microchip Technology Incorporated
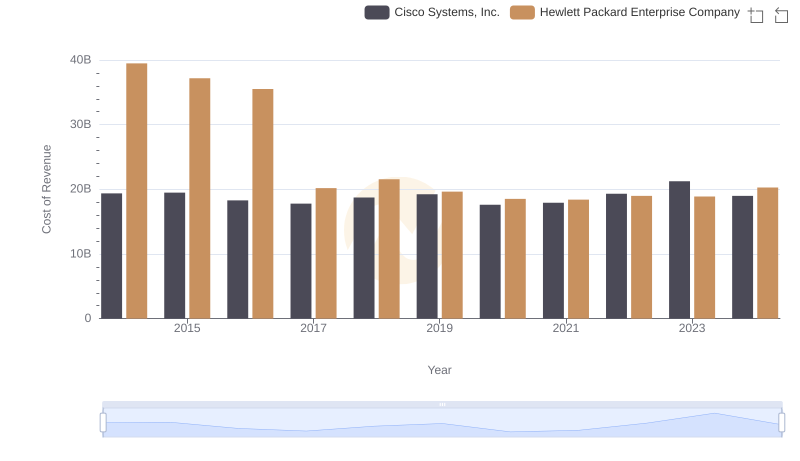
Cost of Revenue Comparison: Cisco Systems, Inc. vs Hewlett Packard Enterprise Company
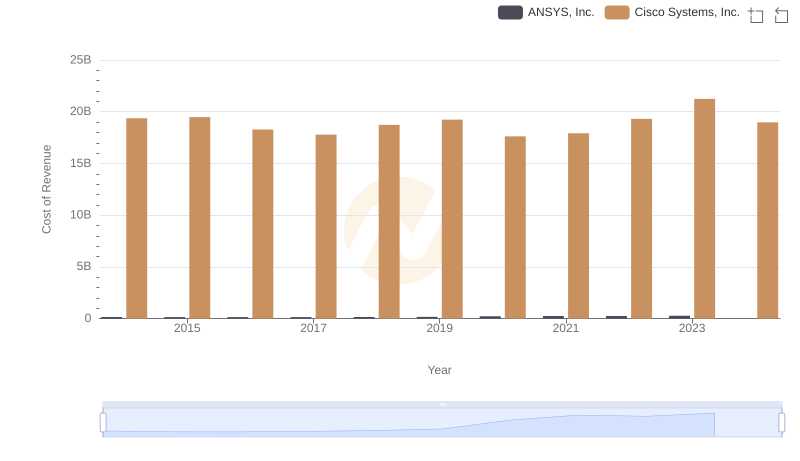
Cost of Revenue Trends: Cisco Systems, Inc. vs ANSYS, Inc.
Cost Insights: Breaking Down Cisco Systems, Inc. and II-VI Incorporated's Expenses
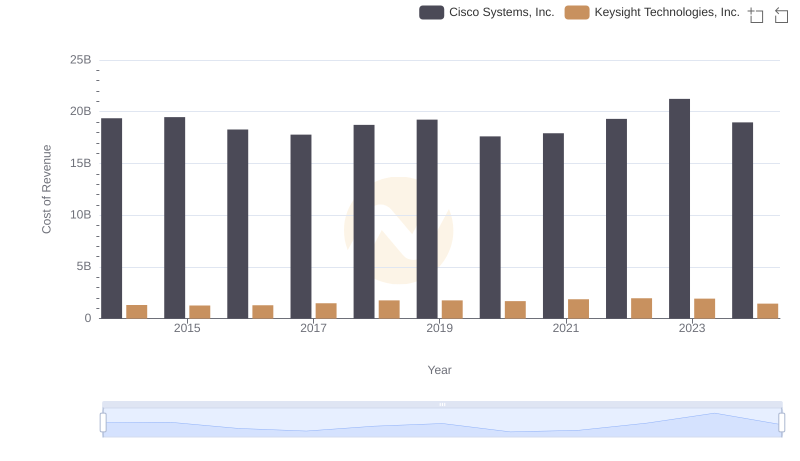
Cisco Systems, Inc. vs Keysight Technologies, Inc.: Efficiency in Cost of Revenue Explored
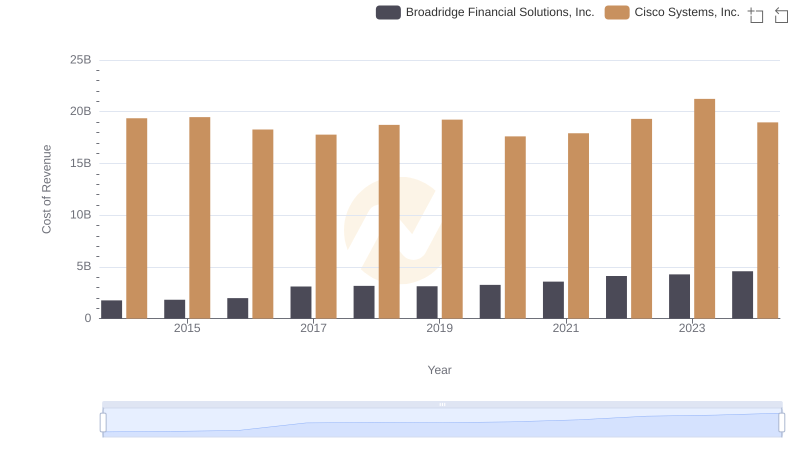
Analyzing Cost of Revenue: Cisco Systems, Inc. and Broadridge Financial Solutions, Inc.
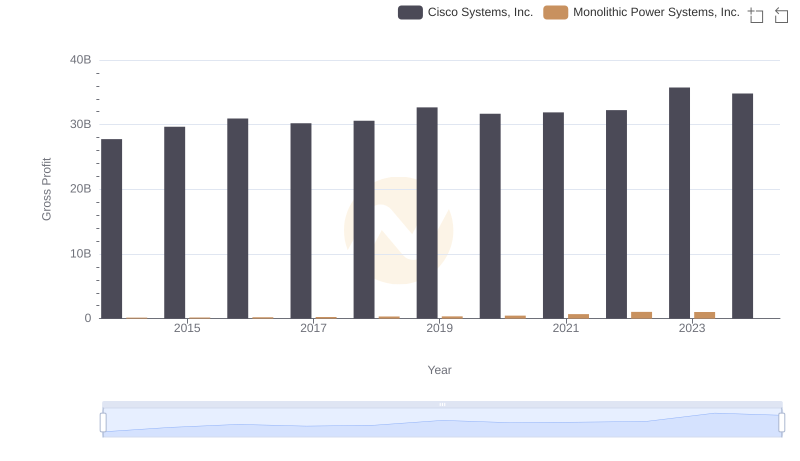
Key Insights on Gross Profit: Cisco Systems, Inc. vs Monolithic Power Systems, Inc.
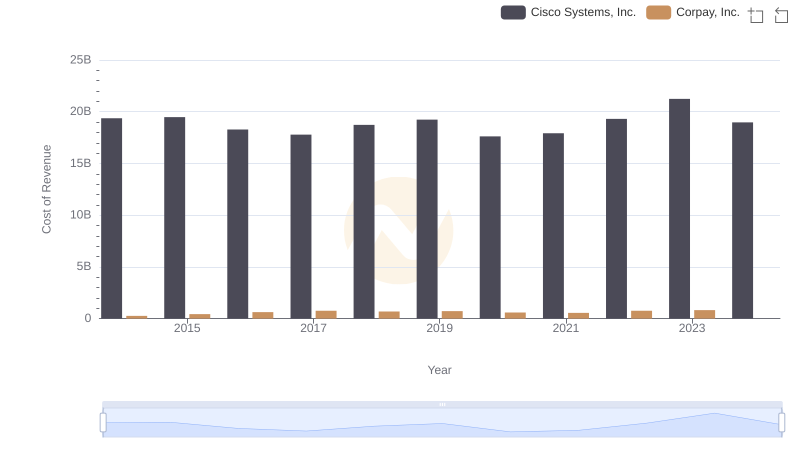
Cost of Revenue Comparison: Cisco Systems, Inc. vs Corpay, Inc.
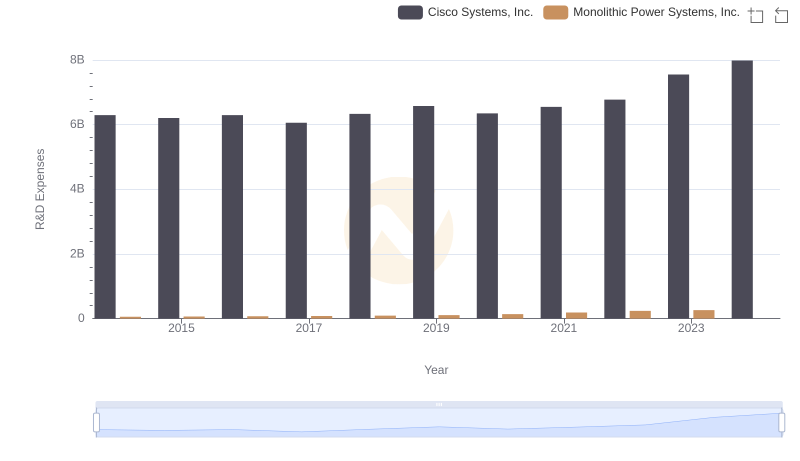
Cisco Systems, Inc. vs Monolithic Power Systems, Inc.: Strategic Focus on R&D Spending
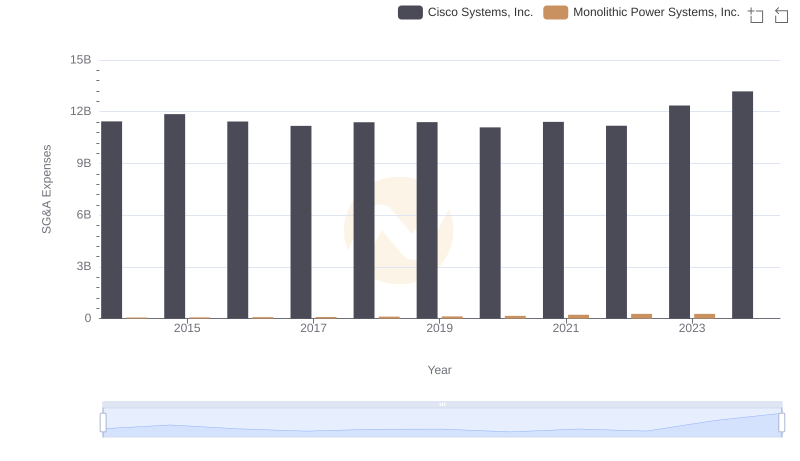
Breaking Down SG&A Expenses: Cisco Systems, Inc. vs Monolithic Power Systems, Inc.
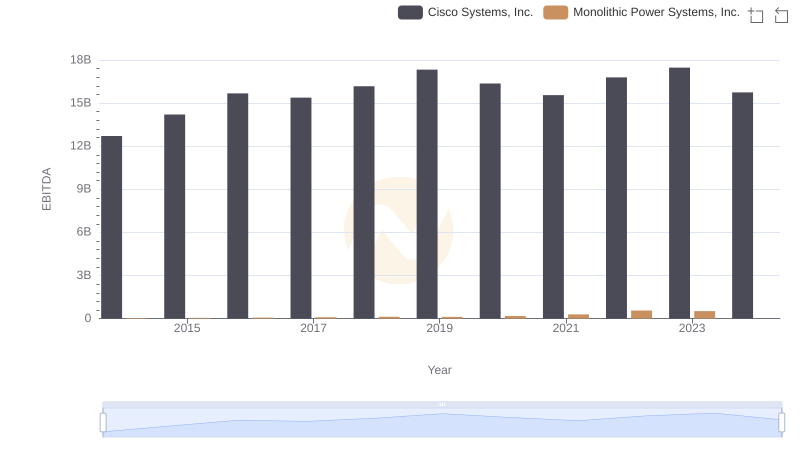
EBITDA Metrics Evaluated: Cisco Systems, Inc. vs Monolithic Power Systems, Inc.