| __timestamp | China Eastern Airlines Corporation Limited | Cintas Corporation |
|---|---|---|
| Wednesday, January 1, 2014 | 78741000000 | 2637426000 |
| Thursday, January 1, 2015 | 77237000000 | 2555549000 |
| Friday, January 1, 2016 | 82676000000 | 2775588000 |
| Sunday, January 1, 2017 | 91592000000 | 2943086000 |
| Monday, January 1, 2018 | 103476000000 | 3568109000 |
| Tuesday, January 1, 2019 | 108865000000 | 3763715000 |
| Wednesday, January 1, 2020 | 72523000000 | 3851372000 |
| Friday, January 1, 2021 | 81828000000 | 3801689000 |
| Saturday, January 1, 2022 | 74599000000 | 4222213000 |
| Sunday, January 1, 2023 | 112461000000 | 4642401000 |
| Monday, January 1, 2024 | 4910199000 |
Data in motion
In the ever-evolving landscape of global business, understanding the cost of revenue is crucial for evaluating a company's financial health. This analysis delves into the cost of revenue trends for Cintas Corporation and China Eastern Airlines Corporation Limited from 2014 to 2023.
Cintas Corporation, a leader in corporate identity uniform programs, has shown a consistent upward trend in its cost of revenue. From 2014 to 2023, Cintas experienced a growth of approximately 86%, reflecting its expanding operations and market reach. The company's cost of revenue peaked in 2023, highlighting its robust business model.
Conversely, China Eastern Airlines, a major player in the aviation industry, exhibited a more volatile pattern. Despite a significant dip in 2020, likely due to the global pandemic, the airline rebounded with a 55% increase by 2023. This fluctuation underscores the industry's sensitivity to external factors.
The data for 2024 is incomplete, indicating potential future insights yet to be uncovered.
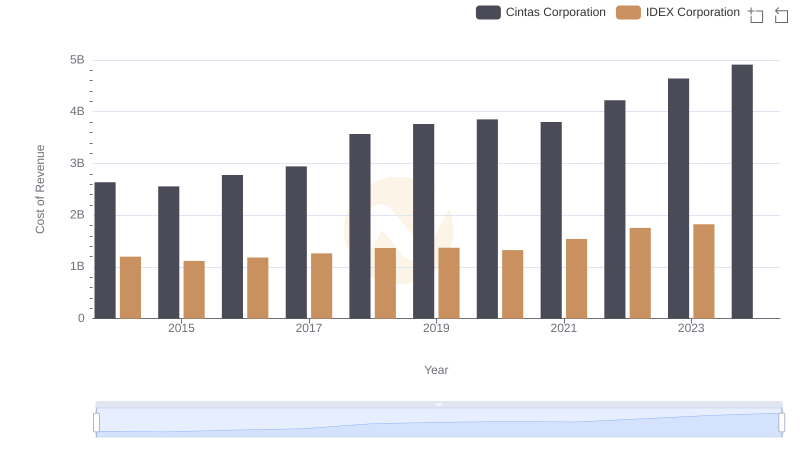
Cintas Corporation vs IDEX Corporation: Efficiency in Cost of Revenue Explored
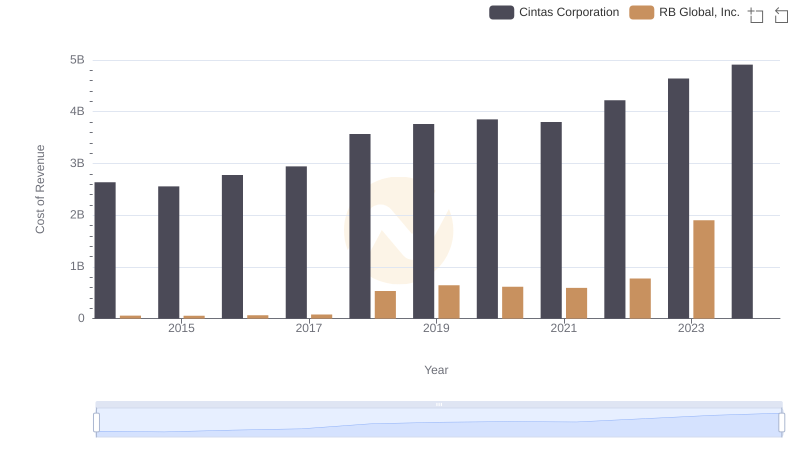
Cintas Corporation vs RB Global, Inc.: Efficiency in Cost of Revenue Explored
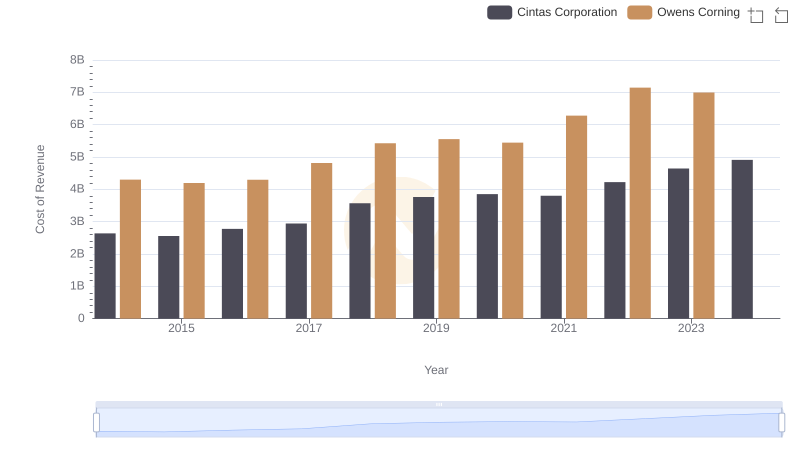
Analyzing Cost of Revenue: Cintas Corporation and Owens Corning
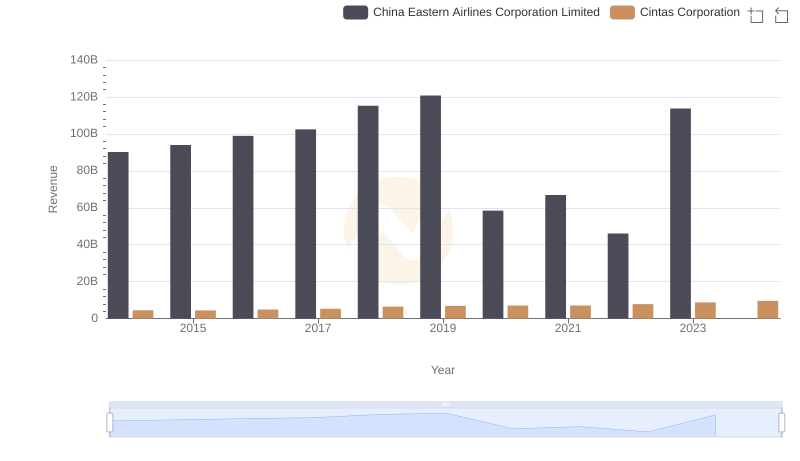
Annual Revenue Comparison: Cintas Corporation vs China Eastern Airlines Corporation Limited
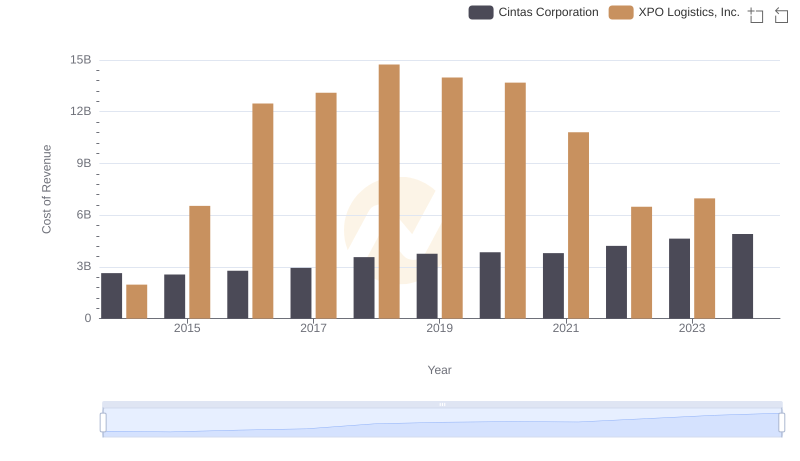
Cost of Revenue Comparison: Cintas Corporation vs XPO Logistics, Inc.
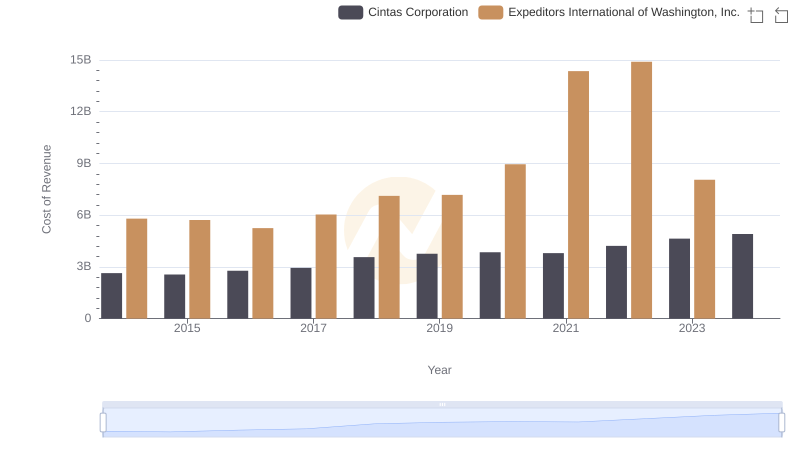
Cost Insights: Breaking Down Cintas Corporation and Expeditors International of Washington, Inc.'s Expenses
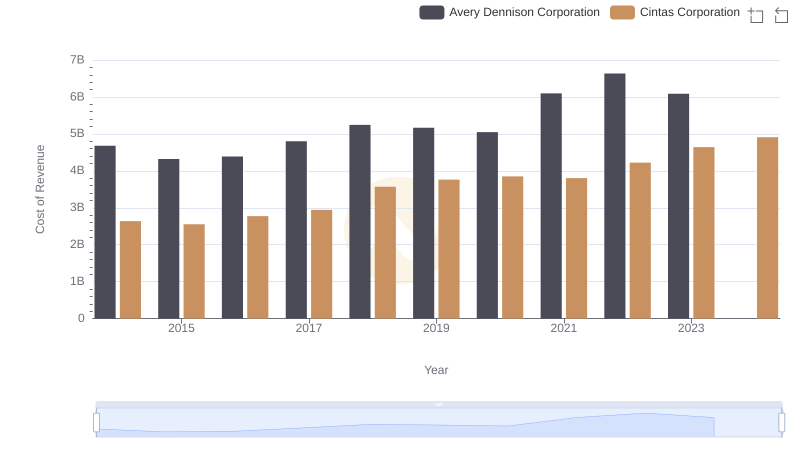
Cost of Revenue: Key Insights for Cintas Corporation and Avery Dennison Corporation
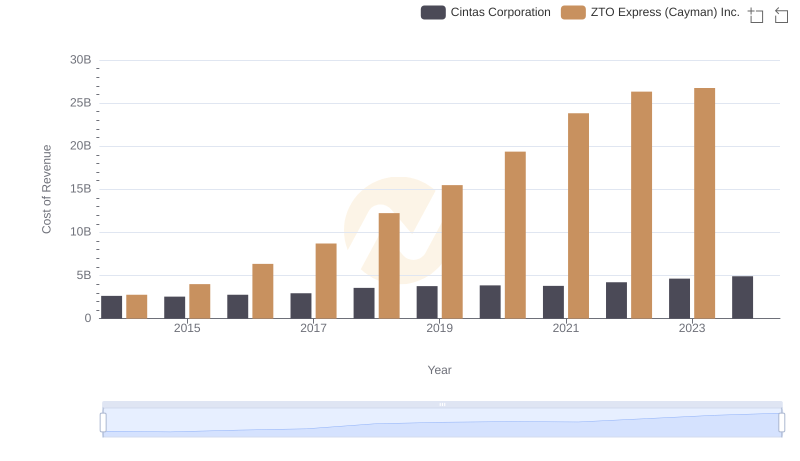
Cost of Revenue Trends: Cintas Corporation vs ZTO Express (Cayman) Inc.
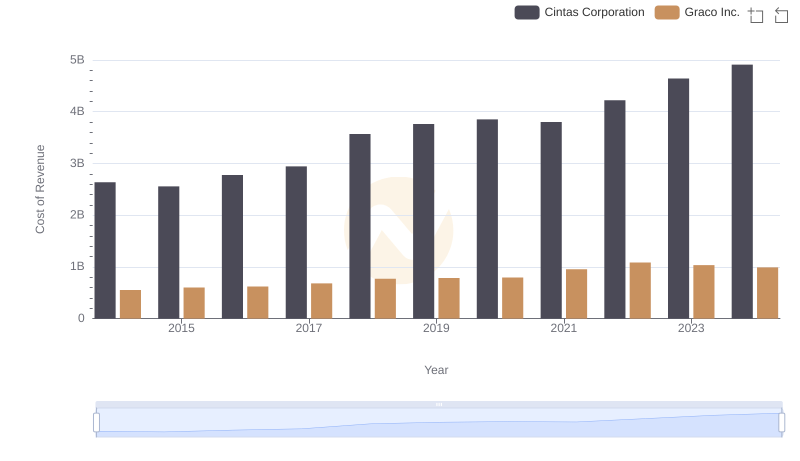
Analyzing Cost of Revenue: Cintas Corporation and Graco Inc.
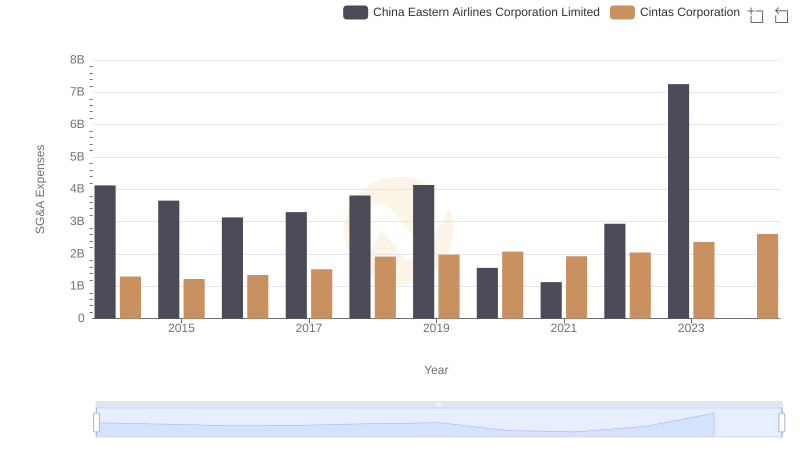
Cintas Corporation and China Eastern Airlines Corporation Limited: SG&A Spending Patterns Compared
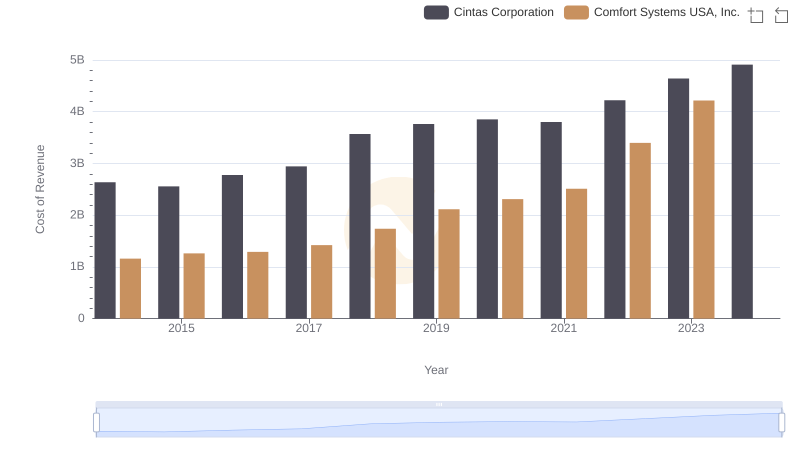
Cost of Revenue Comparison: Cintas Corporation vs Comfort Systems USA, Inc.
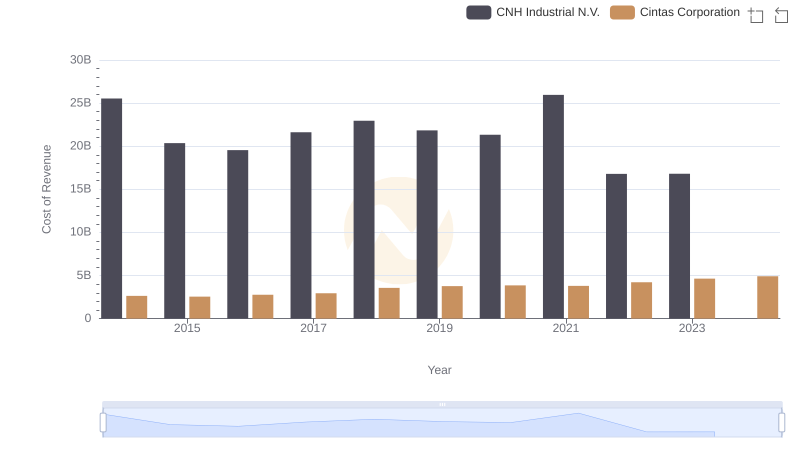
Cost of Revenue: Key Insights for Cintas Corporation and CNH Industrial N.V.