| __timestamp | Cintas Corporation | Owens Corning |
|---|---|---|
| Wednesday, January 1, 2014 | 2637426000 | 4300000000 |
| Thursday, January 1, 2015 | 2555549000 | 4197000000 |
| Friday, January 1, 2016 | 2775588000 | 4296000000 |
| Sunday, January 1, 2017 | 2943086000 | 4812000000 |
| Monday, January 1, 2018 | 3568109000 | 5425000000 |
| Tuesday, January 1, 2019 | 3763715000 | 5551000000 |
| Wednesday, January 1, 2020 | 3851372000 | 5445000000 |
| Friday, January 1, 2021 | 3801689000 | 6281000000 |
| Saturday, January 1, 2022 | 4222213000 | 7145000000 |
| Sunday, January 1, 2023 | 4642401000 | 6994000000 |
| Monday, January 1, 2024 | 4910199000 |
Unlocking the unknown
In the ever-evolving landscape of corporate finance, understanding the cost of revenue is crucial for evaluating a company's efficiency and profitability. This analysis delves into the cost of revenue trends for Cintas Corporation and Owens Corning from 2014 to 2023. Over this period, Cintas Corporation has seen a steady increase in its cost of revenue, growing by approximately 86% from 2014 to 2023. In contrast, Owens Corning experienced a more volatile trajectory, with a peak in 2022, marking a 66% increase from 2014, before a slight decline in 2023. This fluctuation highlights the dynamic nature of the construction materials industry compared to the more stable uniform and facility services sector. Notably, data for Owens Corning in 2024 is missing, indicating potential reporting delays or strategic shifts. Such insights are invaluable for investors and analysts seeking to understand industry trends and company performance.
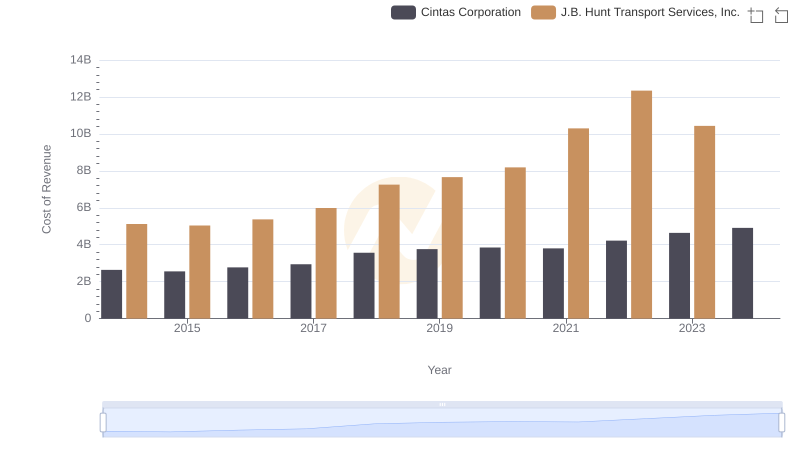
Cintas Corporation vs J.B. Hunt Transport Services, Inc.: Efficiency in Cost of Revenue Explored
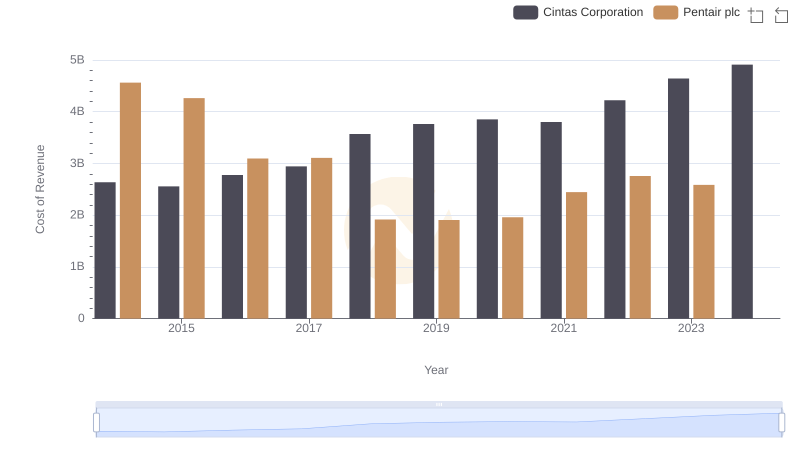
Cost of Revenue Comparison: Cintas Corporation vs Pentair plc
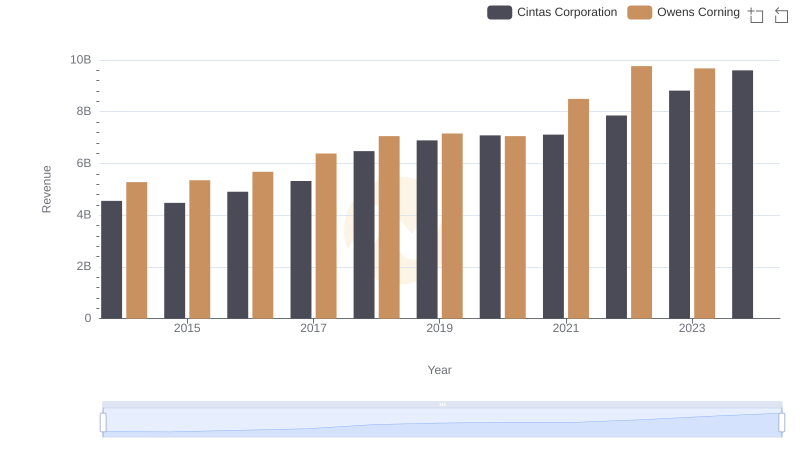
Cintas Corporation and Owens Corning: A Comprehensive Revenue Analysis
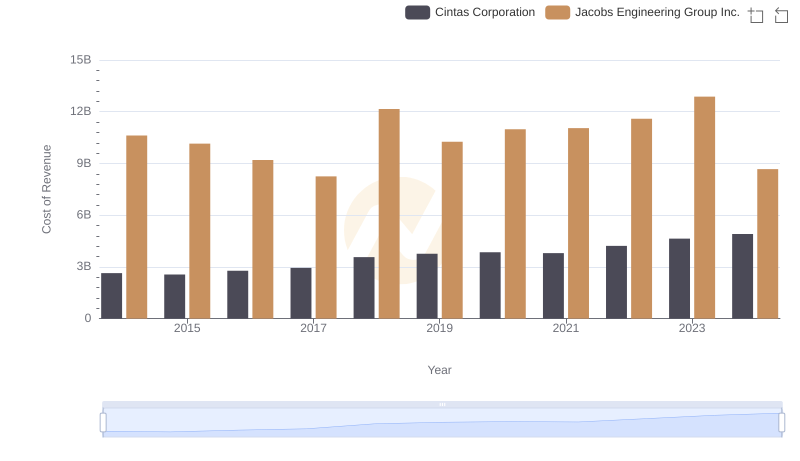
Cintas Corporation vs Jacobs Engineering Group Inc.: Efficiency in Cost of Revenue Explored
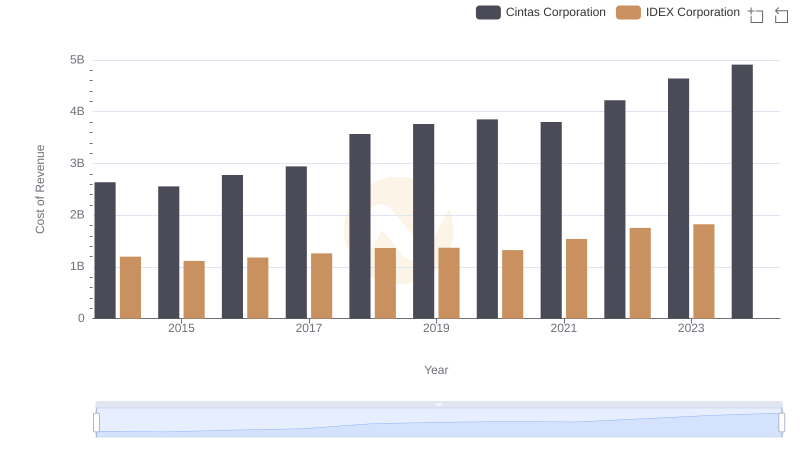
Cintas Corporation vs IDEX Corporation: Efficiency in Cost of Revenue Explored
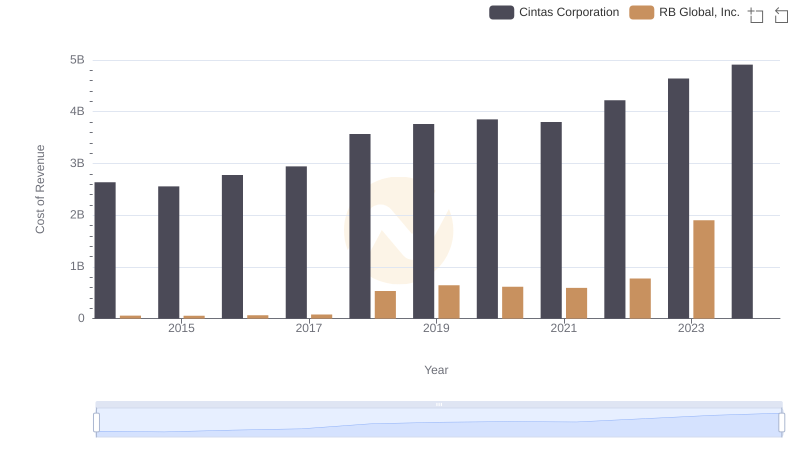
Cintas Corporation vs RB Global, Inc.: Efficiency in Cost of Revenue Explored
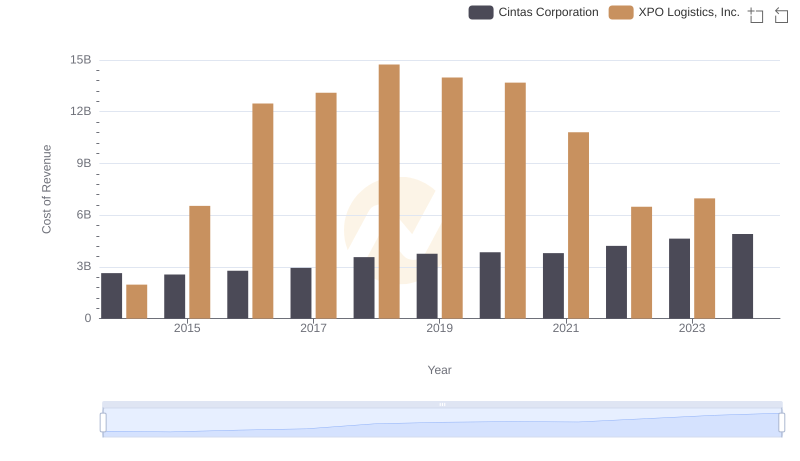
Cost of Revenue Comparison: Cintas Corporation vs XPO Logistics, Inc.
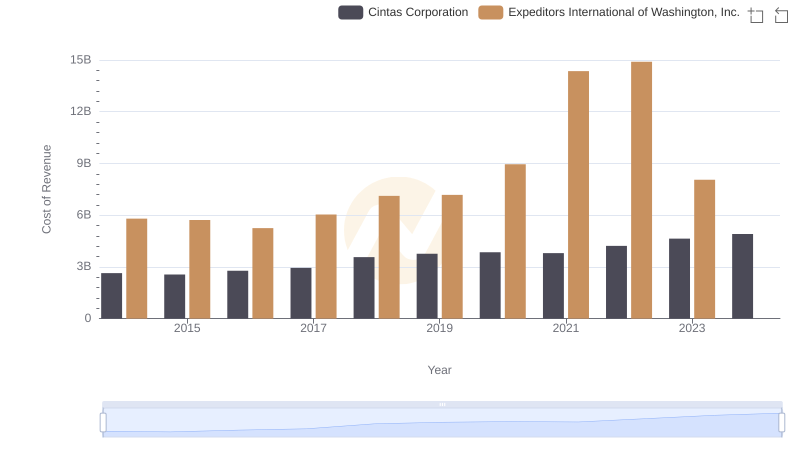
Cost Insights: Breaking Down Cintas Corporation and Expeditors International of Washington, Inc.'s Expenses
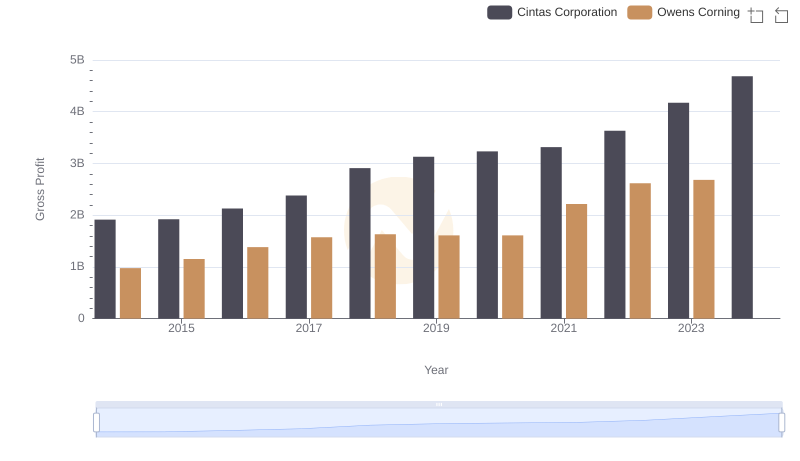
Who Generates Higher Gross Profit? Cintas Corporation or Owens Corning