| __timestamp | Avery Dennison Corporation | Cintas Corporation |
|---|---|---|
| Wednesday, January 1, 2014 | 4679100000 | 2637426000 |
| Thursday, January 1, 2015 | 4321100000 | 2555549000 |
| Friday, January 1, 2016 | 4386800000 | 2775588000 |
| Sunday, January 1, 2017 | 4801600000 | 2943086000 |
| Monday, January 1, 2018 | 5243500000 | 3568109000 |
| Tuesday, January 1, 2019 | 5166000000 | 3763715000 |
| Wednesday, January 1, 2020 | 5048200000 | 3851372000 |
| Friday, January 1, 2021 | 6095500000 | 3801689000 |
| Saturday, January 1, 2022 | 6635100000 | 4222213000 |
| Sunday, January 1, 2023 | 6086800000 | 4642401000 |
| Monday, January 1, 2024 | 6225000000 | 4910199000 |
Unleashing insights
In the ever-evolving landscape of the corporate world, understanding the cost of revenue is crucial for evaluating a company's financial health. This analysis focuses on two industry giants: Cintas Corporation and Avery Dennison Corporation, from 2014 to 2023.
Avery Dennison Corporation has consistently maintained a higher cost of revenue compared to Cintas Corporation. In 2022, Avery Dennison's cost of revenue peaked at approximately $6.6 billion, marking a 53% increase from 2014. Meanwhile, Cintas Corporation saw a steady rise, reaching around $4.6 billion in 2023, a 76% increase from 2014.
The data reveals a consistent upward trend for both companies, with Avery Dennison experiencing a slight dip in 2023. Notably, Cintas Corporation's cost of revenue data for 2024 is missing, indicating potential future updates. This analysis underscores the importance of cost management in sustaining competitive advantage.
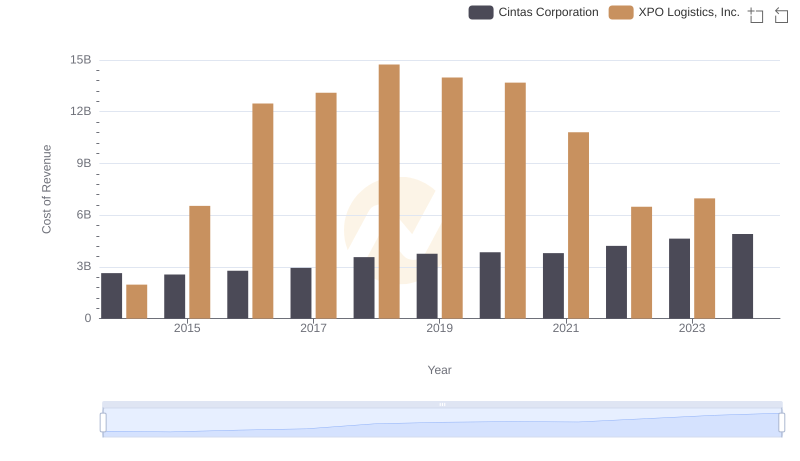
Cost of Revenue Comparison: Cintas Corporation vs XPO Logistics, Inc.
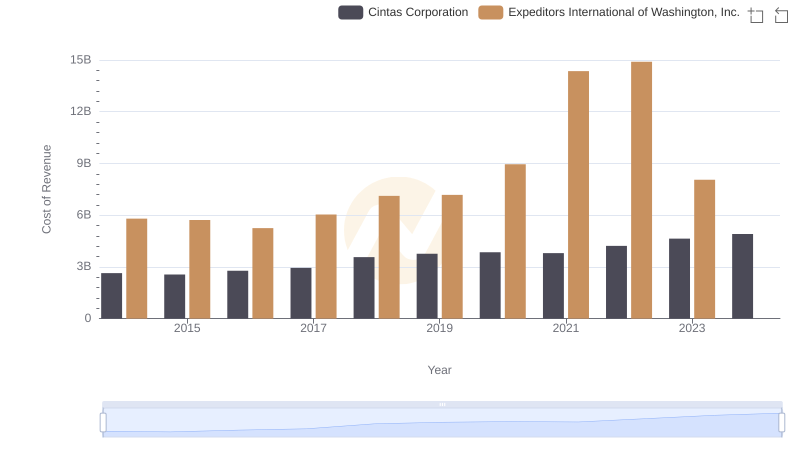
Cost Insights: Breaking Down Cintas Corporation and Expeditors International of Washington, Inc.'s Expenses
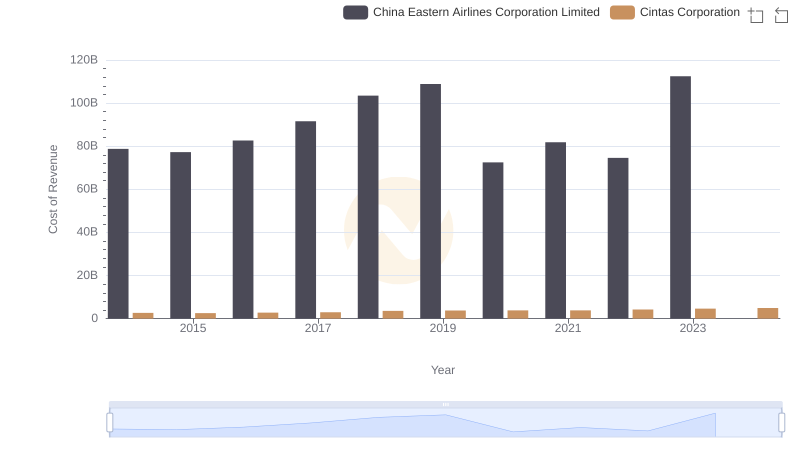
Analyzing Cost of Revenue: Cintas Corporation and China Eastern Airlines Corporation Limited
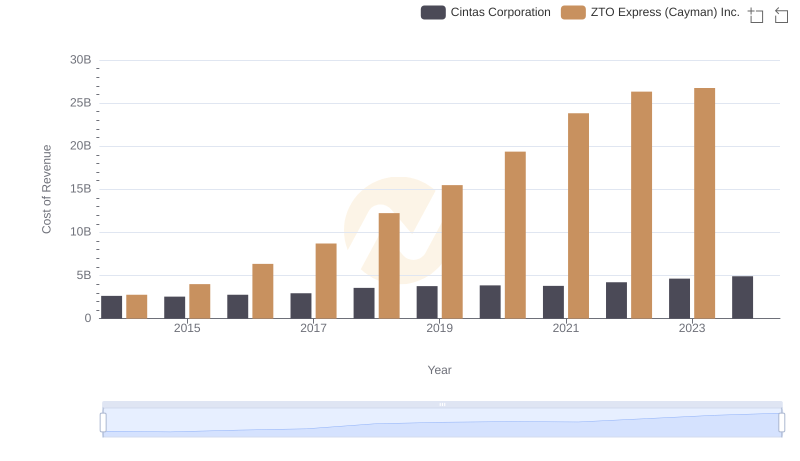
Cost of Revenue Trends: Cintas Corporation vs ZTO Express (Cayman) Inc.
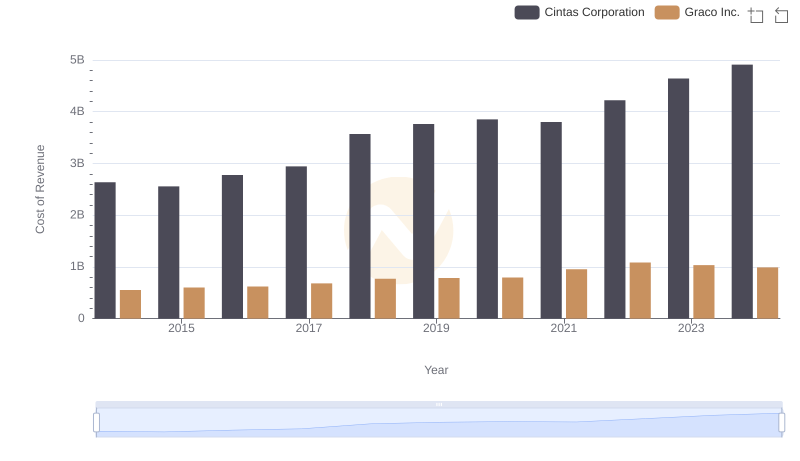
Analyzing Cost of Revenue: Cintas Corporation and Graco Inc.
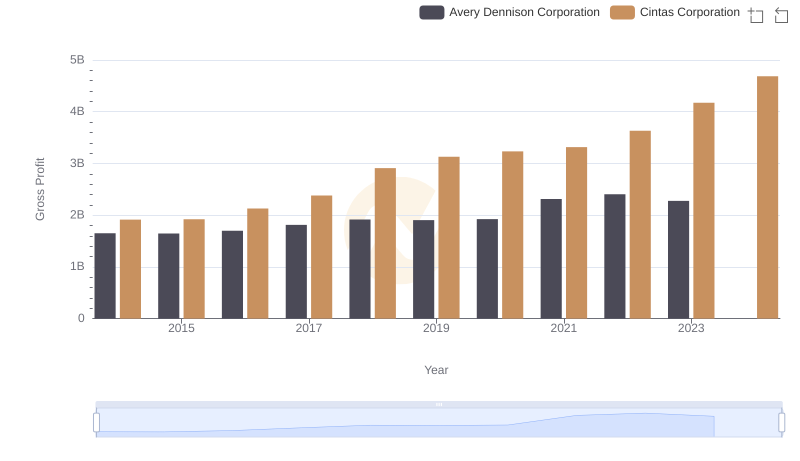
Who Generates Higher Gross Profit? Cintas Corporation or Avery Dennison Corporation
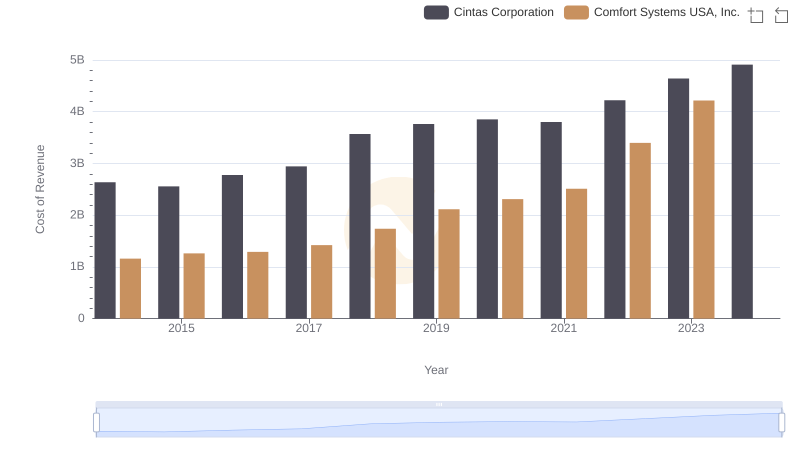
Cost of Revenue Comparison: Cintas Corporation vs Comfort Systems USA, Inc.
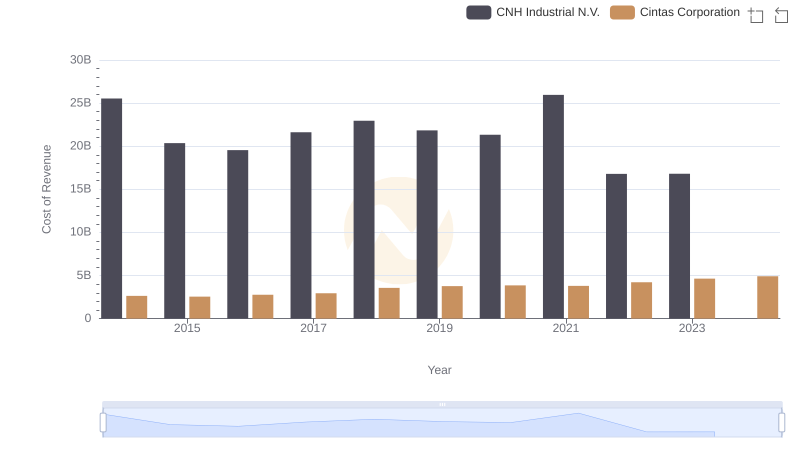
Cost of Revenue: Key Insights for Cintas Corporation and CNH Industrial N.V.
Cost Insights: Breaking Down Cintas Corporation and AECOM's Expenses

A Side-by-Side Analysis of EBITDA: Cintas Corporation and Avery Dennison Corporation