| __timestamp | Cintas Corporation | Expeditors International of Washington, Inc. |
|---|---|---|
| Wednesday, January 1, 2014 | 2637426000 | 5800725000 |
| Thursday, January 1, 2015 | 2555549000 | 5720848000 |
| Friday, January 1, 2016 | 2775588000 | 5247244000 |
| Sunday, January 1, 2017 | 2943086000 | 6037921000 |
| Monday, January 1, 2018 | 3568109000 | 7118083000 |
| Tuesday, January 1, 2019 | 3763715000 | 7178405000 |
| Wednesday, January 1, 2020 | 3851372000 | 8953716000 |
| Friday, January 1, 2021 | 3801689000 | 14358105000 |
| Saturday, January 1, 2022 | 4222213000 | 14900154000 |
| Sunday, January 1, 2023 | 4642401000 | 8054634000 |
| Monday, January 1, 2024 | 4910199000 | 0 |
Infusing magic into the data realm
In the ever-evolving landscape of corporate expenses, understanding cost structures is pivotal. This analysis delves into the cost of revenue trends for Cintas Corporation and Expeditors International of Washington, Inc. from 2014 to 2023. Over this decade, Cintas Corporation's cost of revenue surged by approximately 86%, reflecting a robust growth trajectory. In contrast, Expeditors International experienced a more volatile pattern, peaking in 2022 with a 155% increase from 2014, before a notable decline in 2023. This fluctuation highlights the dynamic nature of the logistics industry, influenced by global supply chain challenges. Notably, data for 2024 is incomplete, underscoring the need for continuous monitoring. As businesses navigate these financial landscapes, understanding such cost dynamics is crucial for strategic decision-making and maintaining competitive advantage.
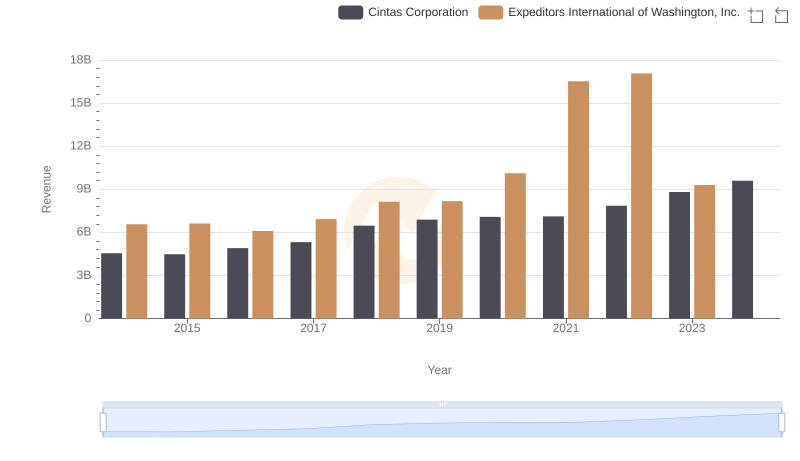
Cintas Corporation or Expeditors International of Washington, Inc.: Who Leads in Yearly Revenue?
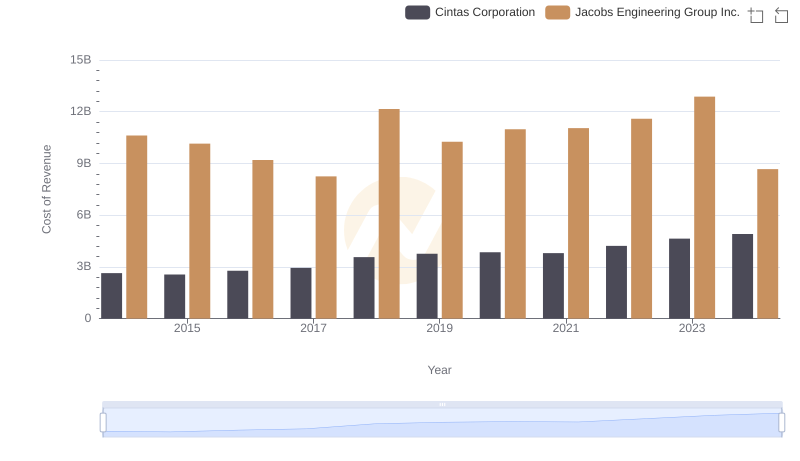
Cintas Corporation vs Jacobs Engineering Group Inc.: Efficiency in Cost of Revenue Explored
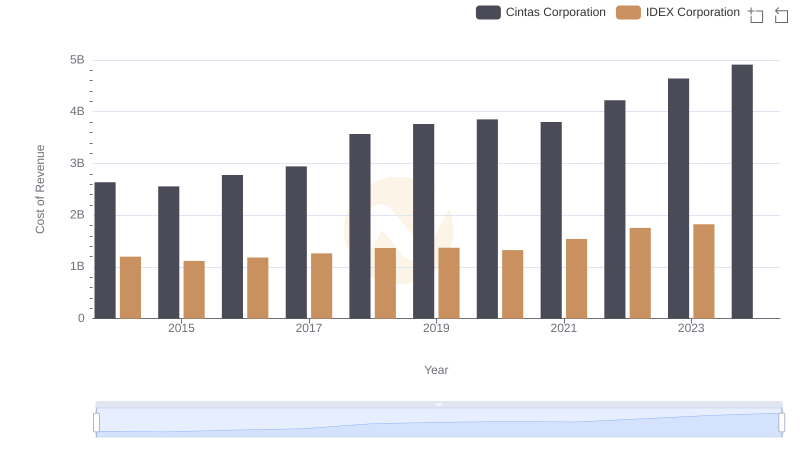
Cintas Corporation vs IDEX Corporation: Efficiency in Cost of Revenue Explored
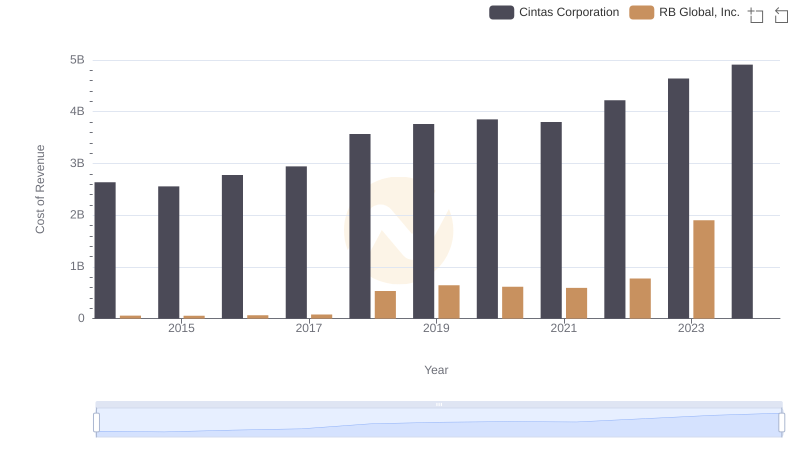
Cintas Corporation vs RB Global, Inc.: Efficiency in Cost of Revenue Explored
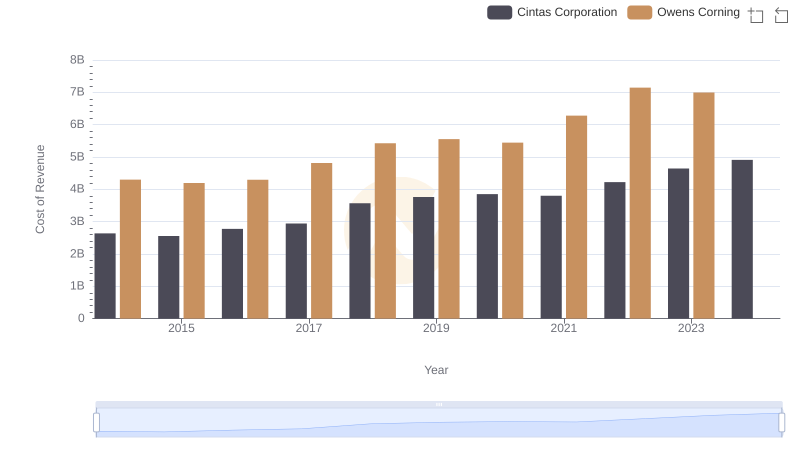
Analyzing Cost of Revenue: Cintas Corporation and Owens Corning
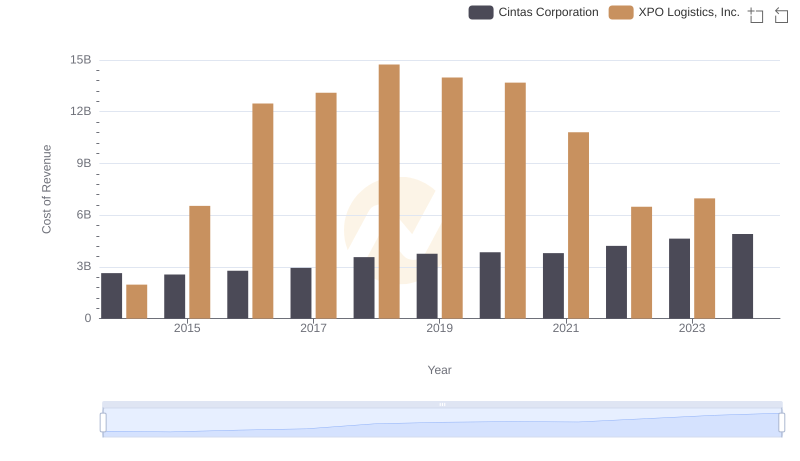
Cost of Revenue Comparison: Cintas Corporation vs XPO Logistics, Inc.
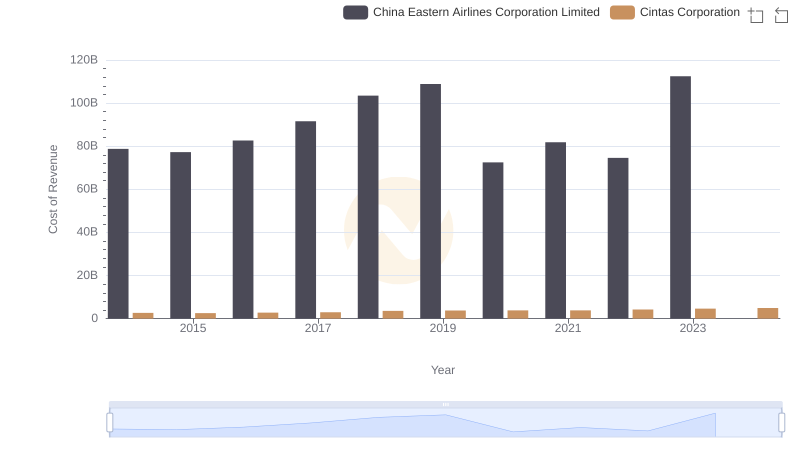
Analyzing Cost of Revenue: Cintas Corporation and China Eastern Airlines Corporation Limited
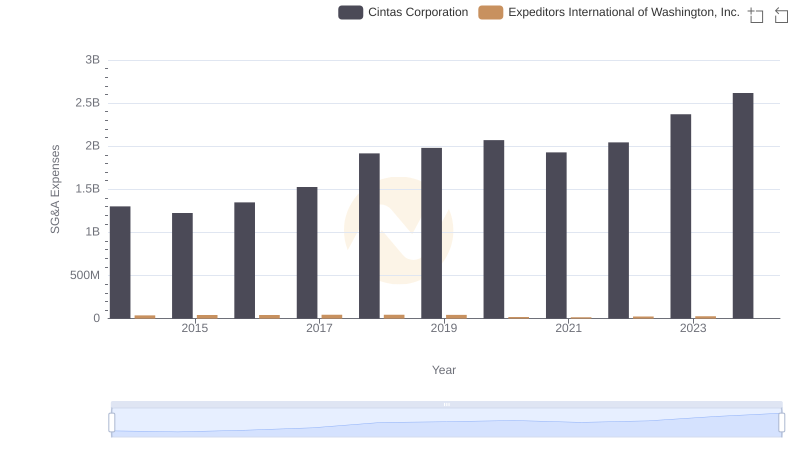
Operational Costs Compared: SG&A Analysis of Cintas Corporation and Expeditors International of Washington, Inc.
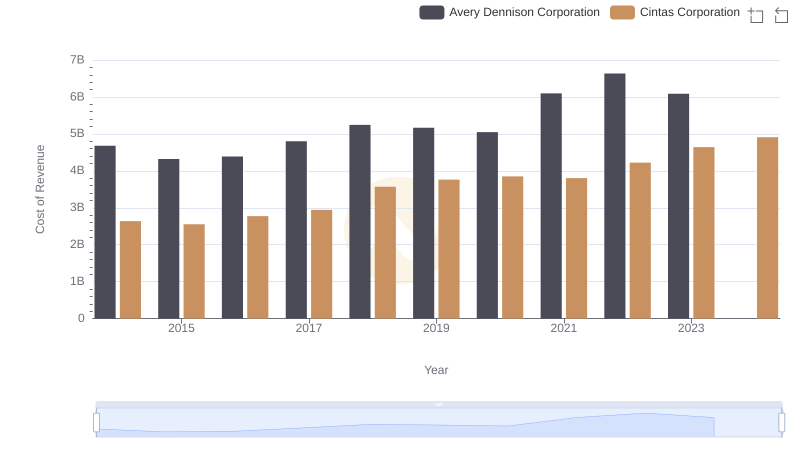
Cost of Revenue: Key Insights for Cintas Corporation and Avery Dennison Corporation
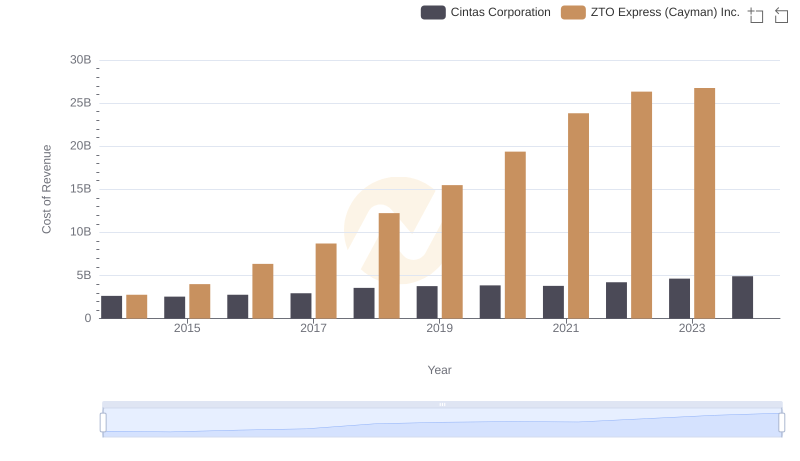
Cost of Revenue Trends: Cintas Corporation vs ZTO Express (Cayman) Inc.
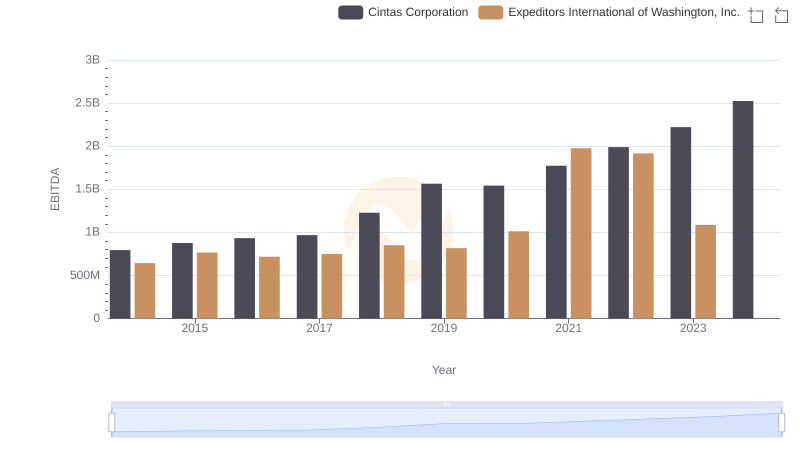
EBITDA Analysis: Evaluating Cintas Corporation Against Expeditors International of Washington, Inc.